


This module provides a summary of R commands and functions that are likely to be used in PH717. This module is not meant to be studied; it is a reference that enables you to look up how to perform a variety of procedures in R.
NOTE: The Contents link on the left side of each page takes you to a hyperlinked table of contents that will make it easy for you to find the specific task you are looking for.
Structure of a Data Set
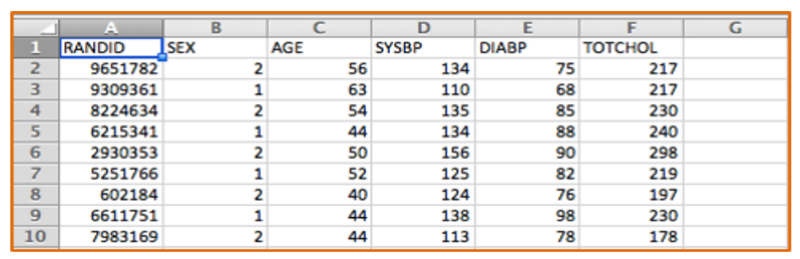
One can think of data sets series of tables with many variables (demographic information, exposures and outcomes) in the columns and each subject listed on a separate row. The figure below shows a portion of an Excel spreadsheet that was used to download the first 10 subjects in a very small subset of the Framingham Heart Study. There is a random identification number in the first column, and columns indicating each subject's sex, age in years, systolic blood pressure, and total cholesterol. There are many more variables, but this small subset gives you an idea of the structure of a data set.
Designating Dichhotomous Variables as True or False
Note that the variable SEX is coded as 1 or 2, and we would need a key to know which is for males and which is for females. A better way to do this for dichotomous variables is to give the variable a more explicit name such as "MALE" and use 1 to indicate "yes" or "true" and 0 to indicate "no" or "false". This will make subequent analysis easier and more explicit.
Excel spreadsheets can be used to collect and store tables of data of this type, and Excel can also be used for a variety of simple statistical tests. For example, Excel can perform chi-squared tests, t-tests, correlations, and simple linear regression. However, it has a number of limitations. Public health researchers and practitioners frequently perform more complex analyses, such as multiple linear regression and multiple logistic regression, which cannot be performed in Excel, so it is useful to become familiar with more sophisticated packages like R.
[NOTE: There is an online learning module on how to use Excel for public health at Using Spreadsheets - Excel & Numbers]
Data Sets
All data sets used in PH717 are comma separated value (.csv) files. These are like spreadsheets in that they contain rows and columns of alphanumeric data, but they have a much simpler format than true spreadsheets, which are .xlsx files. One can import .xlsx files into R, but in PH717, all of the data sets will be in .csv format.
Note also that one can create .csv files using Excel. One would open Excel and insert the data in rows and columns and then use "File", "Save as" to save the data as a .csv file.