


Creating Tables for Dichotomous and Categorical variables
Counts
table(varname)
Provides frequency counts for each value of varname.
Here is a simple 2x2 table showing the number of students reporting suicidal risk in obese (bmi>30) and non-obese students.
table(obese,anyS)
****anyS
obese 0 1
0 704 **159
1 110 *27
Here is a 4x2 table reporting the counts of anyS by grade in high school.
table(grade,anyS)
anyS
grade
******0 **1
9 ***193 50
10 ***192 57
11 ***228 46
12 ***201 33
Proportions
prop.table(table(varname))
This gives the proportion for each value of varname. There are three variation of this, depending on whether you want the proportions by row, by column, or overall as illustrated in the examples below..
- prop.table(table(varname, groupname))
Provides proportion of total for each value of varname by groupname.
prop.table(table(lowdensity,exercise))
exercise
lowdensity
**********0 ********1
1 0.2857143 0.1142857
2 0.2857143 0.3142857
These four proportions add up to 1.0, i.e., each is the proportion based on the total number of observations
- prop.table(table(varname, groupname), 1)
Adding the ,1 flag provides proportion of total within each row.
prop.table(table(lowdensity,exercise),1)
exercise
*******lowdensity
**********0 ********1
1 0.7142857 0.2857143
2 0.4761905 0.5238095
This table gives the proportions across rows, i.e., the proportions are for the total number in each row, and the proportions for each row add up to 1.0.
- prop.table(table(varname, groupname), 2)
Adding the ,2 flag provides proportion of the total within each column
prop.table(table(lowdensity,exercise),2)
exercise
********lowdensity
**********0 ********1
1 0.5000000 0.2666667
2 0.5000000 0.7333333
This table gives the proportions across columns, i.e., the proportions are for the total number in each column, and the proportions in each column add up to1.0.
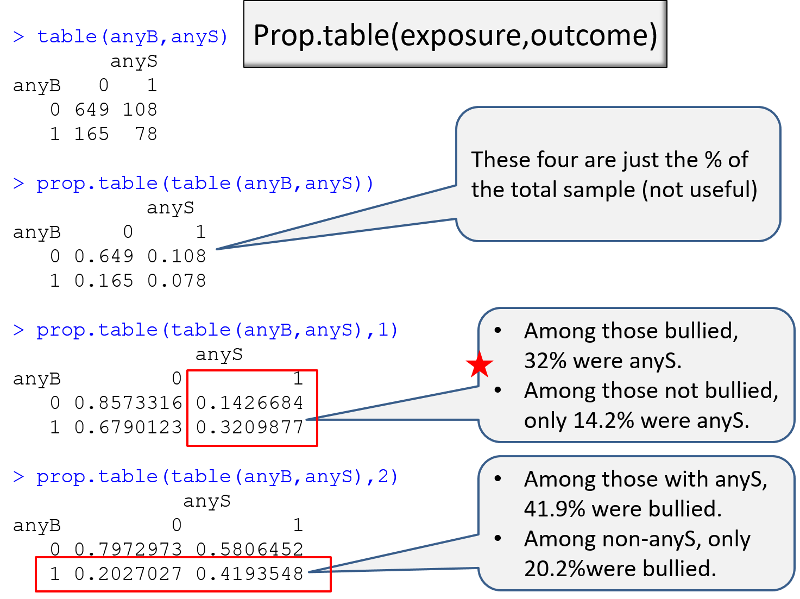
Example: I am conducting a case-control study in which the primary exposure of interest is being bullied (anyB), and the outcome of interest is any indication of suicidal risk (anyS). I want to make a table that compares exposure frequency in the cases and controls. I can use the table() command to get the counts, and I can use the prop.table() command to get the proportions. However, I need to think about a) the order of the variables and b) the "flag" that I use in the prop.table() command.
In the sequence of R output on the left, the epression in parenthesis has the exposure, then the outcome. If no flag is used in prop.table, R gives the proportion in each cell relative to the total sample, which is not helpful. If I add the ",1" flag, I get the desired output, the proportion with the outcome in each exposure group.
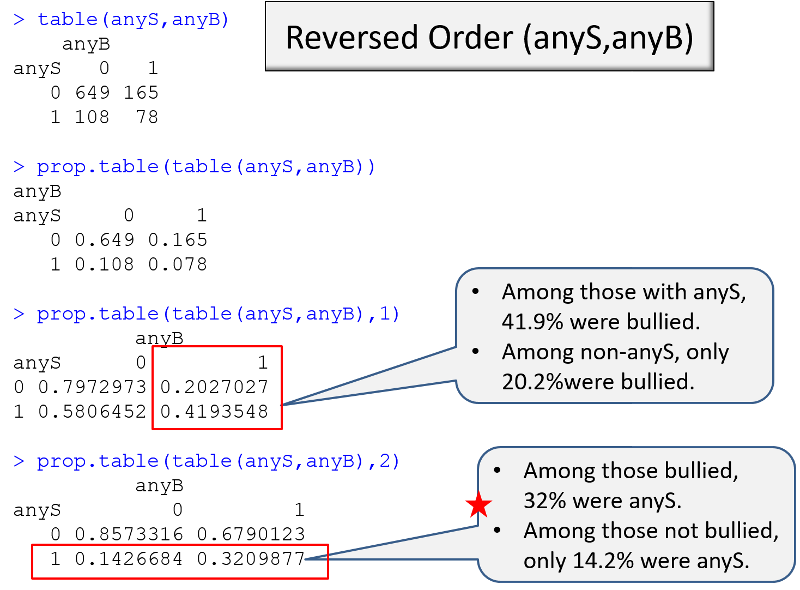
In the sequence on the right, however, it is the ",2" flag in prop.table that provides the proportion with the outcome in each exposure group.