


Confidence Interval for a Mean
95% Confidence Interval from a Mean and Standard deviation
A study measured the verbal IQ of children in 30 children who had been anemic during infancy. The mean was 101.4 and the standard deviation was 13.2. What was the 95% confidence interval for the estimated mean?
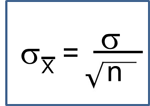
- If the sample had been large (n>30), one could use a Z-score of 1.96 to compute the 95% confidence interval for the mean verbal IQ as follows:

For a 95% confidence interval Zcritical = 1.96.
- If the sample is <30, one should use the t-distribution
 with n-1 degrees of freedom
The problem states a sample size of 30, so we will use use t-critical with 30-1=29 degrees of freedom. A 95% confidence interval would encompass all but the bottom 2.5% and the top 97.5% which correspond to probabilities of 0.025 and 0.975. We can use qt(p,df)to compute the critical value of t.
qt(0.975,29)
[1] 2.04523
qt(0.025,29)
[1] -2.04523
Therefore, the critical value of t is about 2.05. We can now compute the 95% confidence interval:
With 95% confidence, the true mean lies between 96.5 and 106.3.
95% Confidence Interval for a Mean from a Raw Data Set
The confidence interval for a mean is even simpler if you have a raw data set and use R, as shown in this example.
t.test(age)
One Sample t-test
data: age
t = 88.826, df = 34, p-value < 2.2e-16
alternative hypothesis: true mean is not equal to 0
95 percent confidence interval:
65.41128 68.47444
sample estimates:
mean of x
*****66.94286
Here the mean is 66.9. With 95% confidence the true mean lies is between 65.4 and 68.5.
Confidence Intervals for a Mean by Group
You can use tapply()
tapply(varname, groupname, t.test)
tapply(bonedensity,exercise,t.test)
# First is reports on non-exercisers,i.e. exercise=0
$`0`
One Sample t-test
data: X[[i]]
t = 28.088, df = 19, p-value < 2.2e-16
alternative hypothesis: true mean is not equal to 0
95 percent confidence interval:
0.913452 1.060548
sample estimates:
mean of x
**********0.987
# Then it reports on exercisers,i.e. exercise=1
$`1`
One Sample t-test
data: X[[i]]
t = 33.123, df = 14, p-value = 1.062e-14
alternative hypothesis: true mean is not equal to 0
95 percent confidence interval:
1.020043 1.161290
sample estimates:
mean of x
**********1.090667
Confidence Interval for a Proportion
prop.test(numerator, denominator, correct=FALSE)
If the sample size is greater than 30, use correct=FALSE. If the sample size is less, use correct=TRUE.
prop.test(1219,3532,correct=FALSE)
1-sample proportions test without continuity correction
data: 1219 out of 3532, null probability 0.5
X-squared = 338.855, df = 1, p-value < 2.2e-16
alternative hypothesis: true p is not equal to 0.5
95 percent confidence interval:
0.3296275 0.3609695
sample estimates:
p
*****0.3451302
Interpretation: The point estimate for the proportion is 0.345. With 95% confidence, the true proportion is between 0.33 and 0.36.