The T-Distribution
The T-distribution is similar to the standard normal distribution, but it doesn't assume that the sample size is large. It is particularly useful for small samples because it is really a series of distributions that adjust for sample size by taking into account the degrees of freedom. R often defaults to using the t-distribution, because it can be used for both small and large samples. When the sample size is large, the t-distribution is very similar to the standard normal distribution.
The probabilty for a t-statistic
pt(t, df)
This gives the probability corresponding to a t-statistic and a specified number of degrees of freedom, i.e., P(tdf < t)
qt(p, df)
This gives the critical value to the t-distribution associated with the probability p and df (degrees of freedom)= n-1. It answers the question, what is the critical t-statistic for a given probability and specified degrees of freedom, i.e., what is the minimum value of t for a specified probabilty and a specifed degrees of freedom.
Probability of a Sample Mean Less Than a Given Value
Previously, we used Z-scores to compute that probability that an individual in a population with known mean and standard deviation would have a measurement (e.g., BMI) less than or greater than a certain value. However, this method addresses a different question: what is the probability that a sample mean will have a value less than or greater than a certain value. To illustrate, we can once again use the population of 60-year old men in the Framingham cohort.

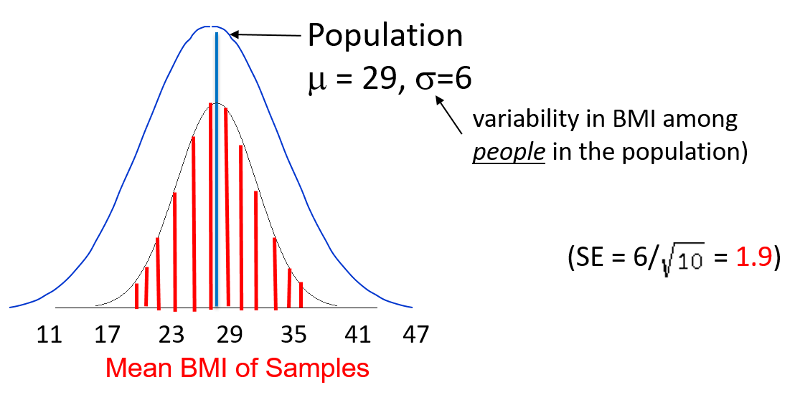
If you recall, the population had a mean BMI of 29 with a standard deviation of 6. Now that we are addressing a sample mean rather than an individual, we need to use the standared error instead of the standard deviation. In this case, the standard error is 1.9, as shown above.
Question: Given this scenario, what is the probability of taking a sample from the population and finding a sample mean less than 23?
- Sample Size >30: If the sample size was large (>30), one could compute a Z-score to compute this. Suppose the sample size is 50.


pnorm(-7.07)
[1] 7.746685e-13
- Sample Size <30: If the sample size is less than 30, say 10, one should use the t-distribution.


pt(-3.16,9)
[1] 0.005775109
Even with the smaller sample, the probability of a sample mean less than 23 is very small, but no where near a small as that obtained with a larger sample using the standard normal disttribution.


