


The Probability of a Sample Mean
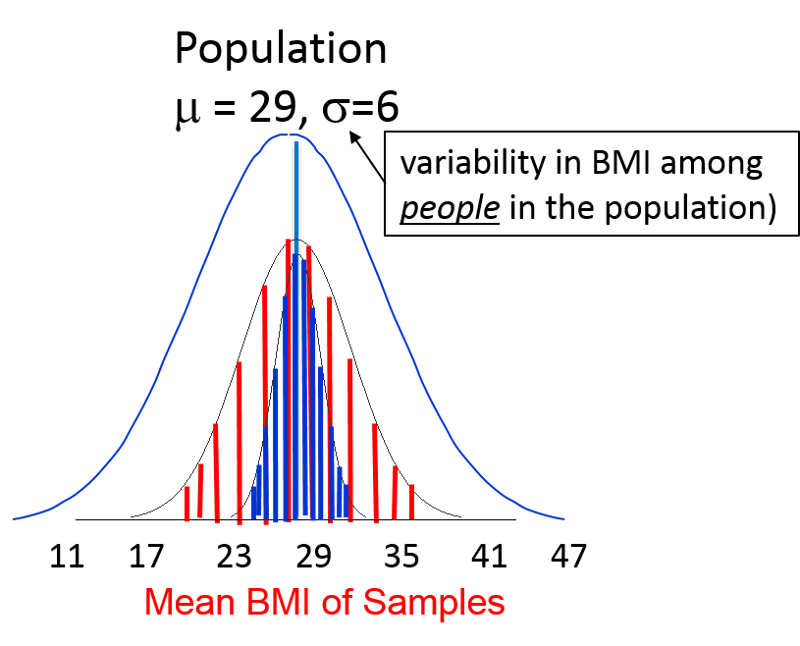
We saw in the previous section that if we take samples, the distribution of the sample means will be approximately normal. This will hold true even when the underlying population is not normally distributed, provided we take samples of n=30 or greater. If the population is normally distributed, the sample means will be normally distributed even with smaller samples. [This is known as the Central Limit Theorem, which states that when a large number of random samples are drawn from a population, the means of these samples will be normally distributed.]
Since the sample means are normally distributed, we can use Z scores to compute probabilities with respect to means.
Note that earlier in our discussion we were using Z scores to compute probabilities for values among individuals in a population, using the equation:


Now we are shifting to a new type of questions regarding the probability of obtaining means in samples drawn from a population. Since sampling means are normally distributed, we can use a modified version of the equation above:

With this new tool, let's go back to the population of 60 year old men with mean BMI, μ =29 and σ =6, and take multiple samples of n=40 men. What is the probability that the mean BMI will be <30 if BMI μ=29 , σ=6? In other words, what percentage of possible samples would have mean BMI <30, if μ=29 and σ=6? Remember that even though the population we are sampling has individual variability of σ=6, the distribution for the sampling means is the standard error (σ/√n)
First, we use the equation:
And then we look up the probability for this Z score from the table, or we can use R as follows:
> pnorm(1.05)
[1] 0.8531409
So, the probability that the mean BMI of the samples is <30 is 85%.
|
|
 Test Yourself
Problem #1
Total cholesterol in children aged 10-15 is assumed to follow a normal distribution with a mean of 191 and a standard deviation of 22.4. What proportion of children 10-15 years of age would be classified as hyperlipidemic (defined as a total cholesterol level over 200)?
Problem #2
Same scenario as the previous question. Total cholesterol in children aged 10-15 is assumed to follow a normal distribution with a mean of 191 and a standard deviation of 22.4. A sample of 20 children is selected. What is the probability that the mean cholesterol level of the sample will be > 200?
Problem #3
Same scenario: Total cholesterol in children aged 10-15 is assumed to follow a normal distribution with a mean of 191 and a standard deviation of 22.4. What proportion of children 10-15 years of age have total cholesterol between 180-190?
