


Confidence in Our Estimates
We almost never know the true parameters in a population (e.g., a population mean, a population proportion, a risk ratio, a risk difference, an odds ratio, etc.), and our goal is to make valid inferences about population parameters based on a single random sample from the population.
There are two types of estimates for population parameters:
- A point estimate for a population parameter is the best estimate of that parameter based on a sample, but having estimated a parameter, such as a mean, how confident are we that the estimate reflects the true parameter in the population?
- A confidence interval is a range of plausible values for the population parameter with a level of confidence attached (e.g., 95% confidence that the range or interval contains the parameter).
To address this we must calculate and interpret confidence intervals for
- means
- and proportions,
- risk ratios,
- odds ratios,
- etc.
Example: A team was assembled to estimate the mean waiting time (in minutes) in the Emergency Room (ER) of a particular suburban hospital during weekends. Two members of the team recorded a sample of waiting times from which they submitted estimates of the mean waiting time.
Sample #1: Was based on a sample of wait times for 100 random patients in the ER on weekends, and found a mean waiting time of X = 37.85 minutes to see a medical care provider. This is the point estimate.
Sample #2: The 2nd investigator based her estimate on a sample off 35 patients in the ER during weekends and found a mean waiting time of X = 33.75 minutes. (A second point estimate)
Which estimate is better, i.e., more accurate?
If by "more accurate" we mean closer to the true mean waiting time, we can't really tell. However, intuitively you know that the larger sample is more likely to be close to the true mean, and the notion that the larger sample is more likely to provide a better estimate is consistent with the Central Limit Theorem, since the larger sample will provide an estimate with a narrower standard error (SE). We are more confident in the larger sample.
The 95% Confidence Interval for Mean
A frequently used convention is to report the 95% confidence interval for a mean, i.e., the range within which the true mean is likely to lie, with 95% confidence.
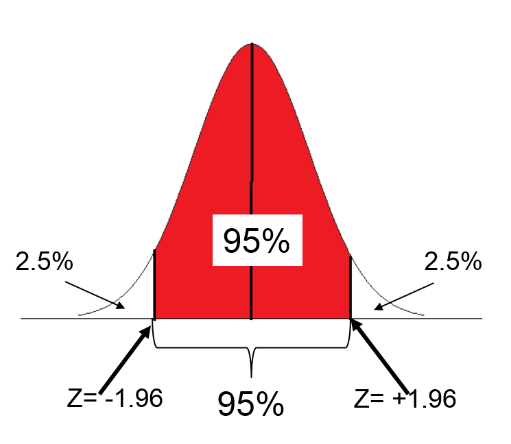
Consider a normal distribution. The range of Z scores that would likely capture 95% of the observations would be the 95% of Z scores in the middle of the standard normal distribution, i.e., excluding the 2.5% of the Z scoress at the bottom of the standard normal distribution and the 2.5% of Z scores at the top. The Z-scores for these upper and lower limits for a 95% confidence interval are:
> qnorm(0.025)
[1] -1.959964
> qnorm(0.975)
[1] 1.959964
In other words, 95% of the observations will lie within Z= -1.96 to Z= 1.96 as shown in the figure below.
So, when estimating a mean with a large sample (>30), the 95% confidence interval for a point estimate is:
Point estimate ± 1.96(SE)
Where 1.96 (SE) is the "margin of error."
Now, back to the studies of waiting times in the ER:
- The first ER waiting room time study had a point estimate of 37.85 minutes with a sample of n=100. The 95% confidence interval for the mean waiting time is:


Therefore, the 95% confidence interval is: (35.99 to 39.71)
Interpretation: Mean waiting time in the first sample was 37.85 minutes. We are 95% confident that the true mean waiting time in the ER is between 35.99 and 39.71 minutes. (margin of error = 1.86 minutes)
- The second point estimate was 33.75 with a sample of n=35. The 95% confidence interval:

Therefore, the 95% confidence interval is: (30.60, 36.90)
The first interval has a width of 3.71, and the second one has a width of 6.3, so the first one with the larger sample size is narrower and provides a more precise estimate of the true mean.
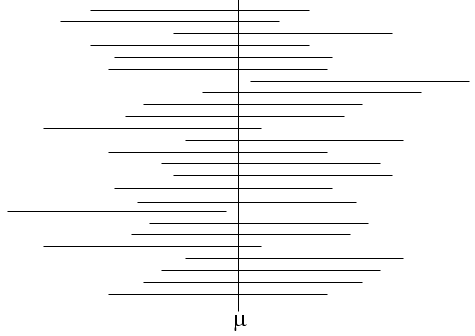
What the Confidence Interval Really Means
Strictly speaking, what the 95% confidence interval really means is that if we took a very large number of random samples of the same sample size and computed the mean and 95% confidence interval for each, about 95% of them would contain the true mean in the population from which the samples were drawn. In the figure below the true mean is shown with a vertical line; the many horizontal lines represent the 95% confidence intervals that were computed when many samples where taken to estimate the mean. The confidence intervals are all the same width, because the same sample size was used, but the confidence are not all centered on the true mean. They vary in position because the means that were obtained varied. However, about 95% of the confidence intervals included the true mean.
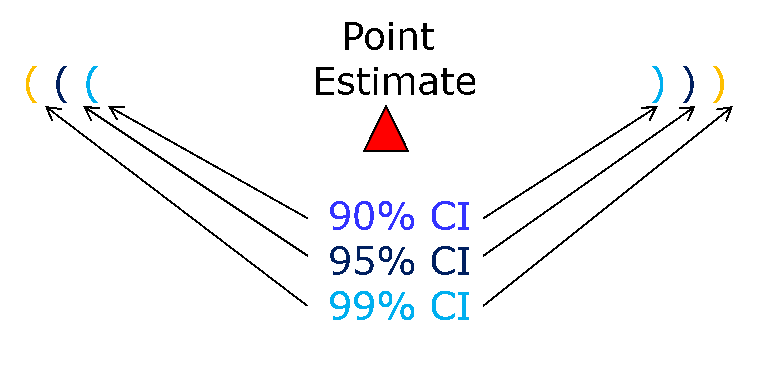
Other Confidence Intervals
A 95% confidence interval is most commonly used in biomedical and health sciences, but one can easily compute confidence intervals of any width just by selecting the appropriate Z score for the desired interval. The table below shows the Z scores that one would use for a specified confidence interval. The 95% confidence interval, which corresponds to a Z score of 1.96, is highlighted in red because it is the most commonly used confidence interval in the biomedical literature.
| Confidence Level |
Z score |
|
99.99% |
3.819 |
|
99.9% |
3.291 |
|
99% |
2.576 |
|
95% |
1.960 |
|
90% |
1.645 |
|
80% |
1.282 |
Also note that the confidence interval's width increases as the degree of confidence increases. For example, for a given sample a 99% confidence interval is always wider than the 95% confidence interval since it must "cast a wider net" in order to have a better chance of capturing the true value.