


Confidence Intervals for Sample Size Less Than 30
In the preceding discussion we have been using s, the population standard deviation, to compute the standard error. However, we don't really know the population standard deviation, since we are working from samples. To get around this, we have been using the sample standard deviation (s) as an estimate. This is not a problem if the sample size is 30 or greater because of the central limit theorem. However, if the sample is small (<30) , we have to adjust and use a t-value instead of a Z score in order to account for the smaller sample size and using the sample SD.
Therefore, if n<30, use the appropriate t score instead of a z score, and note that the t-value will depend on the degrees of freedom (df) as a reflection of sample size. When using the t-distribution to compute a confidence interval, df = n-1.
Calculation of a 95% confidence interval when n<30 will then use the appropriate t-value in place of Z in the formula:


The T-distribution
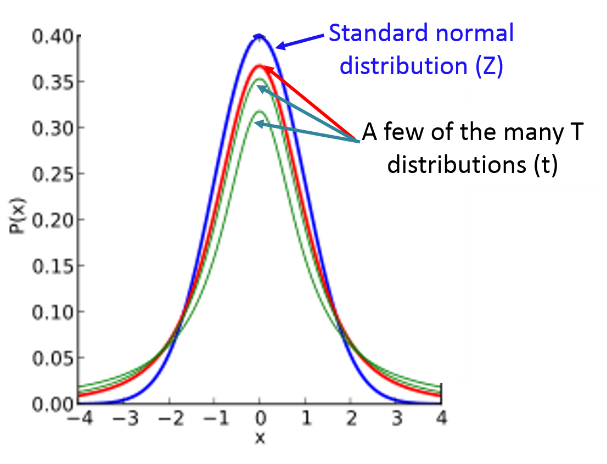
One way to think about the t-distribution is that it is actually a large family of distributions that are similar in shape to the normal standard distribution, but adjusted to account for smaller sample sizes. A t-distribution for a small sample size would look like a squashed down version of the standard normal distribution, but as the sample size increase the t-distribution will get closer and closer to approximating the standard normal distribution.
The table below shows a portion of the table for the t-distribution. Notice that sample size is represented by the "degrees of freedom" in the first column. For determining the confidence interval df=n-1. Notice also that this table is set up a lot differently than the table of Z scores. Here, only five levels of probability are shown in the column titles, whereas in the table of Z scores, the probabilities were in the interior of the table. Consequently, the levels of probability are much more limited here, because t-values depend on the degrees of freedom, which are listed in the rows.
| Confidence Level |
80% |
90% |
95% |
98% |
99% |
|
Two-sided test p-values |
.20 |
.10 |
.05 |
.02 |
.01 |
|
One-sided test p-values |
.10 |
.05 |
.025 |
.01 |
.005 |
|
Degrees of Freedom (df) |
|
|
|
|
|
|
1 |
3.078 |
6.314 |
12.71 |
31.82 |
63.66 |
|
2 |
1.886 |
2.920 |
4.303 |
6.965 |
9.925 |
|
3 |
1.638 |
2.353 |
3.182 |
4.541 |
5.841 |
|
4 |
1.533 |
2.132 |
2.776 |
3.747 |
4.604 |
|
5 |
1.476 |
2.015 |
2.571 |
3.365 |
4.032 |
|
6 |
1.440 |
1.943 |
2.447 |
3.143 |
3.707 |
|
7 |
1.415 |
1.895 |
2.365 |
2.998 |
3.499 |
|
8 |
1.397 |
1.860 |
2.306 |
2.896 |
3.355 |
|
9 |
1.383 |
1.833 |
2.262 |
2.821 |
3.250 |
|
10 |
1.372 |
1.812 |
2.228 |
2.764 |
3.169 |
|
11 |
1.362 |
1.796 |
2.201 |
2.718 |
3.106 |
|
12 |
1.356 |
1.782 |
2.179 |
2.681 |
3.055 |
|
13 |
1.350 |
1.771 |
2.160 |
2.650 |
3.012 |
|
14 |
1.345 |
1.761 |
2.145 |
2.624 |
2.977 |
|
15 |
1.341 |
1.753 |
2.131 |
2.602 |
2.947 |
|
16 |
1.337 |
1.746 |
2.120 |
2.583 |
2.921 |
|
17 |
1.333 |
1.740 |
2.110 |
2.567 |
2.898 |
|
18 |
1.330 |
1.734 |
2.101 |
2.552 |
2.878 |
|
19 |
1.328 |
1.729 |
2.093 |
2.539 |
2.861 |
|
20 |
1.325 |
1.725 |
2.086 |
2.528 |
2.845 |
Notice that the value of t is larger for smaller sample sizes (i.e., lower df). When we use "t" instead of "Z" in the equation for the confidence interval, it will result in a larger margin of error and a wider confidence interval reflecting the smaller sample size.
With an infinitely large sample size the t-distribution and the standard normal distribution will be the same, and for samples greater than 30 they will be similar, but the t-distribution will be somewhat more conservative. Consequently, one can always use a t-distribution instead of the standard normal distribution. However, when you want to compute a 95% confidence interval for an estimate from a large sample, it is easier to just use Z=1.96.
Because the t-distribution is, if anything, more conservative, R relies heavily on the t-distribution.
 Test Yourself
Problem #1
Using the table above, what is the critical t score for a 95% confidence interval if the sample size (n) is 11?
Problem #2
A sample of n=10 patients free of diabetes have their body mass index (BMI) measured. The mean is 27.26 with a standard deviation of 2.10. Generate a 90% confidence interval for the mean BMI among patients free of diabetes.
Confidence Intervals for a Mean Using R
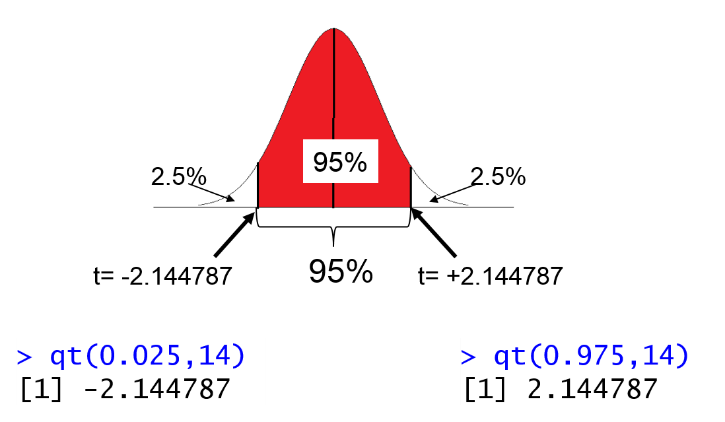
Instead of using the table, you can use R to generate t-values. For example, to generate t values for calculating a 95% confidence interval, use the function qt(1-tail area,df).
For example, if the sample size is 15, then df=14, we can calculate the t-score for the lower and upper tails of the 95% confidence interval in R:
> qt(0.025,14)
[1] -2.144787
> qt(0.975,14)
[1] 2.144787
Then, to compute the 95% confidence interval we could plug t=2.144787 into the equation:
Confidence Intervals from Raw Data Using R
It is also easy to compute the point estimate and 95% confidence interval from a raw data set using the " t.test" function in R. For example, in the data set from the Weymouth Health Survey I could compute the mean and 95% confidence interval for BMI as follows. First, I would load the data set and give it a short nickname. Then I would attach the data set, and then use the following command:
> t.test(bmi)
The output would look like this:
One Sample t-test
data: bmi
t = 228.5395, df = 3231, p-value < 2.2e-16
alternative hypothesis: true mean is not equal to 0
95 percent confidence interval:
26.66357 27.12504
sample estimates:
mean of x
26.8943
R defaults to computing a 95% confidence interval, but you can specify the confidence interval as follows:
> t.test(bmi,conf.level=.90)
This would compute a 90% confidence interval.
Test Yourself
Lozoff and colleagues compared developmental outcomes in children who had been anemic in infancy to those in children who had not been anemic. Some of the data are shown in the table below.
| Mean + SD |
Anemia in Infancy (n=30) |
Non-anemic in Infancy (n=133) |
|
Gross Motor Score |
52.4+14.3 |
58.7+12.5 |
|
Verbal IQ |
101.4+13.2` |
102.9+12.4 |
Source: Lozoff et al.: Long-term Developmental Outcome of Infants with Iron Deficiency, NEJM, 1991
Compute the 95% confidence interval for verbal IQ using the t-distribution
Link to the Answer in a Word file
