


Measures of Association Summarize Comparisons of Frequency
In cross-sectional surveys and cohort studies we can compute the frequency of disease in each exposure group, and we can compare them by either looking at their ratio (dividing one frequency by the other) or their difference (subtracting one frequency from the other).
- Depending on how detailed follow-up is, cohort studies provide the option of using either cumulative incidence in the exposed group (CIe) and unexposed group (CIu) or incidence rate in the exposed group (IRe) and unexposed group (IRu).
- Cross-sectional studies provide prevalence of exposure (Pe) and prevalence of outcome (Pu).
Ratios (relative measures)
- Risk Ratio: ratio of CIe/CIu
- Incidence Rate Ratio: IRe/IRu
- Prevalence Ratio: Pe/Pu
Differences (absolute measures)
- Risk Difference: CIe - CIu
- Rate Difference: IRe - IRu
- Prevalence Difference: Pe - Pu
Contingency Tables
Contingency tables make it easier to summarizes counts by exposure and outcome status.
One method lists outcome categories in the rows and the exposure categories in the column as shown in the table below. The letters "a", "b", "c", and "d" represent the number of subjects in each category.
| Exposed | Unexposed | Row Totals | |
|---|---|---|---|
| Diseased | *******a | *******b | ******a+b |
| Not Diseased | *******c | *******d | ******c+d |
| Column Totals | *****a+c | *****b+d | ***a+b+c+d |
An alternate method lists outcome categories in columns and the exposure categories in rows as shown in the next table.
| Diseased | Not Diseased | Row Totals | |
|---|---|---|---|
| Exposed | *******a | *******b | *****a+b |
| Not Exposed | *******c | *******d | *****c+d |
| Column Totals | ****a+c | *****b+d | ***a+b+c+d |
Either method is acceptable, but you should be consistent and be clear about which orientation is being used, because it will affect subsequent calculations.
Consider the following example illustrating a cohort of freshmen in high school who were enrolled in a cohort study in 1990. None of them had respiratory diseases at the time, but a number of them had begun smoking (indicated by the blue dots). When the cohort was re-examined in 2018, many of the subjects had developed respiratory disease, as shown by the red icons.
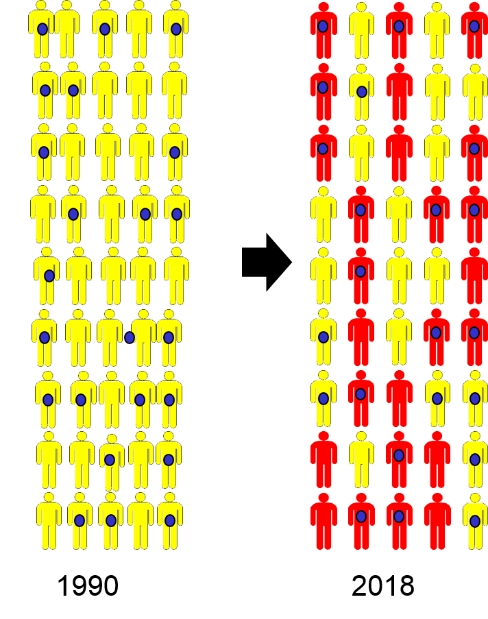
This information could be summarized with a contingency table as follows:
| Smokers | Non-smokers | Row Totals | |
|---|---|---|---|
| Resp. Disease | **********16 | ***********9 | **********25 |
| No Resp. Disease | ***********7 | **********13 | **********20 |
| Column Totals | *********23 | **********22 | **********45 |
Alternatively, the data could be summarized with the other orientation:
| Resp. Dis | No Resp. Dis. | Row Totals | |
|---|---|---|---|
| Smokers | **********16 | ***********7 | 27 |
| Non-smokers | ***********9 | **********13 | 22 |
| Column Totals | **********25 | **********20 | 45 |
In this example the tables summarize the counts for two exposure categories and two outcome categories, so they are often referred to as "2 x 2" tables ("2 by 2"). The exposed group is also referred to as the "index" group, and the unexposed group is referred to as the "reference" or "comparison" group.
It is also possible to have more than two categories of exposures or outcomes. For example,
Smoking
- Smoke >2 packs/day
- Smoke 1-2 packs/day
- Smoke <1 pack/day
- Never-smoker [This is the logical "reference" or "comparison" group.]
Amount of Exercise
- Highest quintile
- Quintile 4
- Quintile 3
- Quintile 2
- Lowest quintile [This is the logical "reference" or "comparison" group.]
BMI
- <20
- 20 – 24.9 [This is "normal" BMI & would be a logical reference group.]
- 25.0 – 29.9
- ≥ 30.0
In these examples the reference group is the group against which the other categories would be compared. However, note that sometimes selection of a reference group is arbitrary. For exercise, for example, we might have designated the highest quintile as the reference group and compared the other exposure groups to the most active group.