Part 2 - Measures of Association Between Exposure and Disease
When searching for the determinants of a health outcome, one generally relies first on descriptive epidemiology to generate hypotheses about associations between health-related exposures and outcomes. Once hypotheses are generated, analytical epidemiology is employed to test hypotheses by drawing samples of people and comparing groups to determine whether health outcomes differ based on exposure status. If individuals with a given exposure are found to have a greater probability of developing a particular outcome, it suggests an association, and, conversely, if the groups have the same probability of developing the outcome regardless of their exposure status, it suggests that particular exposure is not associated with a greater risk of disease. In either event one must then consider whether the findings were misleading because of sampling error, bias, or confounding (the issue of validity is one that we will address later), In other words, we must consider alternative explanations that might invalidate our conclusions. The remainder of this module we will focus on methods for comparing groups and computing an estimate of the magnitude of association between an exposure and a health outcome and how to interpret the findings.
Basic Strategies for Analytical Epidemiology Studies
Study designs will be discussed more completely in a later module, but several basic design strategies are introduced here in order facilitate an understanding of how one measures the magnitude of an association.
Cross-sectional surveys were discussed in module 1B on descriptive studies. These studies assess exposure status and health outcome status at a single point in time, providing prevalence measures.
Cohort studies enroll a sample of subjects who do not yet have the health outcomes of interest and assess their exposure status, e.g., whether they smoke or not, and then follow the subjects forward in time and record whether they develop a particular health outcome, such as coronary heart disease. When sufficient time has passed, the subjects are grouped according to their exposure status, and the incidence of disease is compared among two or more levels of exposure. For example, a greater incidence of heart disease in smokers than in non-smokers suggests that smoking is associated with a greater risk of coronary heart disease. If the cohort study is conducted in a way that provides individual follow-up, it is possible to record when outcomes occur and if and when subjects become lost to follow-up. This then provides the option of computing either cumulative incidence or incidence rates. The basic design of a cohort study is illustrated in the figure below.
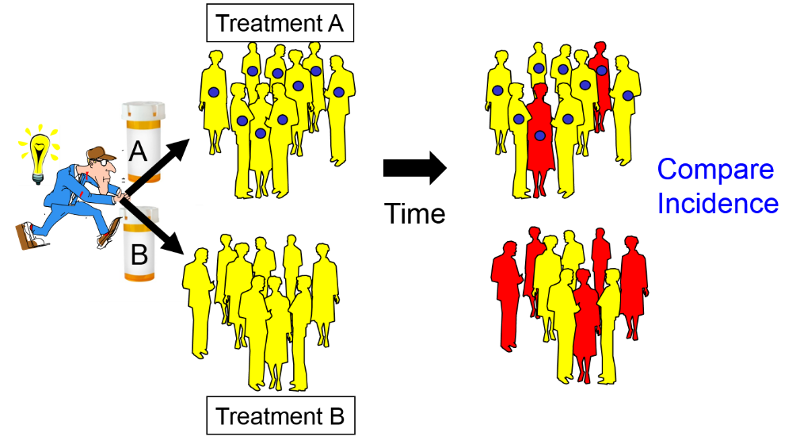
Intervention studies (randomized clinical trials) are similar in design to cohort studies in that they enroll subjects who do not yet have the outcome of interest, and subjects are followed over time in order to compare incidence of the outcome among two or more exposure groups. However, in contrast to cohort studies, exposures are allocated to subjects by the investigators, usually in a randomized fashion. For example, if investigators wanted to test the efficacy of low-dose aspirin (test agent A) in preventing heart attacks compared to an inactive placebo (test agent B), eligible subjects would be randomly allocated to take either agent A or agent B, as illustrated in the image below.

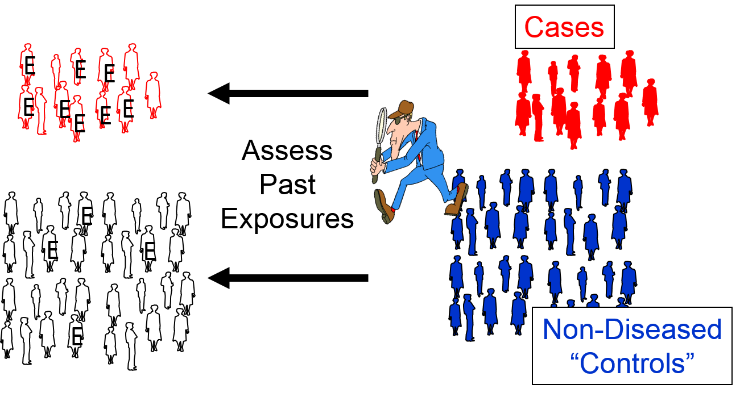
Case-control studies use a different analytic strategy. They enroll a group of "cases" who already have the outcome of interest, and then they enroll a comparison group of "controls" who do not. Investigators then assess past exposures in the two groups and compare the odds of past exposure. Greater odds of exposure in the cases suggests an association. Note that in the illustration below the odds of exposure (indicated by the letter "E") are greater among the case subjects than in the non-diseased control subjects.

We will address these design strategies in greater detail in subsequent modules, but for now we will focus on formulating hypotheses and then testing hypotheses by computing measures of association in cross-sectional surveys, cohort studies, and intervention studies.

