


Prevalence
Prevalence is the proportion of a population that has the disease or condition of interest at a specified point in time, and it indicates the probability that a member of the population has a given condition at a point in time. It is, therefore, a way of assessing the overall burden of disease in the population at a given point in time. As such, it is a useful measure for administrators when assessing the need for services or treatment facilities. One way to think about prevalence is that it provides a "snapshot" of the proportion of the population with a specific condition at a point in time.
Prevalence is calculated as the number of people in a population who have a given disease at a specific point in time divided by the total number of people living in the population at that point in time.


And the relevant time is stated in words.
Example:
In 2003 it was estimated that there were 8,263 HIV+ people in Massachusetts. The population of MA in 2003 was about 5.7 million.

Note that the "total source population" does not always mean the total population; it means the total population of people in whom we are measuring prevalence. For example, the source population may consist of only females living in the population at that point in time.
Occasionally you will see the term period prevalence, which is similar to point prevalence, except that the "point in time" is broader.
Example:
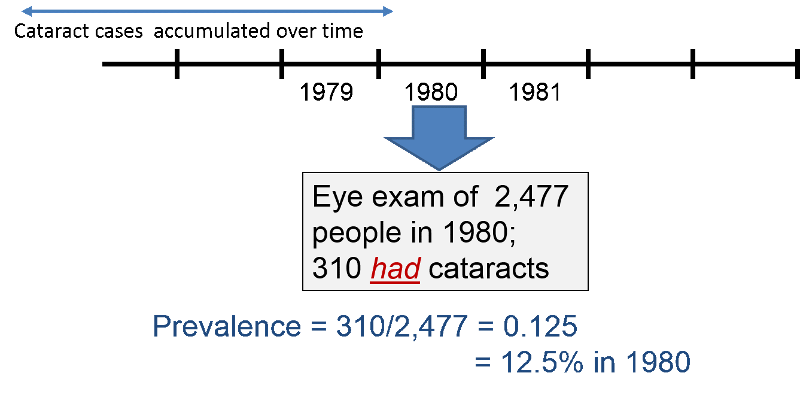
In 1980 the investigators in the Framingham Heart Study (FHS) wanted to determine the prevalence of cataracts in their current subjects. Some subjects had died since the beginning of the study in 1948, and some others had developed cataracts both before and since the start of the study. The investigators asked subjects to come to the FHS building to be examined for cataracts. During 1980, 2,477 subjects were examined, and 310 were found to have cataracts at that time. Therefore, the prevalence of cataracts was 310/2477= 0.125 = 12.5% in 1980.
 Test Yourself
Consider a source population consisting of 1,000 adults. Assume that no subjects moved in or out of the population over the next 12 years, but there were some deaths. Among the 1,000 subjects, 990 remained alive and free of cancer from 2001 to 2012. Events in the other 10 subjects are depicted in the image below. Subjects 1, 2, 3, and 4 were known to have lung cancer in 2001. Dashed lines indicate the ongoing presence of lung cancer in living subjects (dashed lines), and deaths are indicated in the figure.
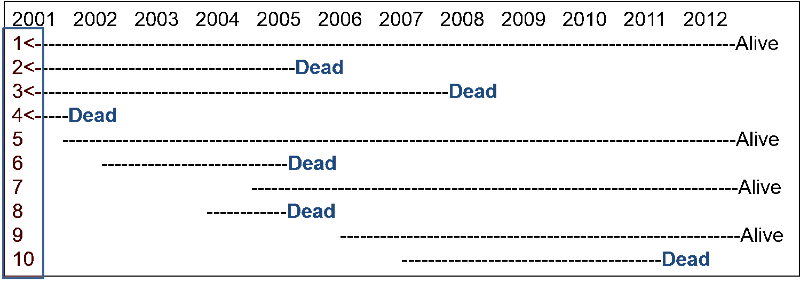
For this exercise answer the questions below as simple fractions showing the numerator and the denominator in order to make sure you understand prevalence. (Ordinarily, you would compute the decimal fraction and express in as, e.g., 7 per 1,000 population in 2007). Compute your own answers before looking at the correct answer.
Question 1: What was the prevalence of lung cancer in 2001?
Question 2: What was the prevalence of lung cancer in 2007?
Question 3: What was the prevalence of lung cancer in 2012?