


Relationship Among Prevalence, Incidence Rate, and Average Duration of Disease
Prevalence and incidence measure different phenomena, but they are related. Prevalence is the proportion of a population that has a condition at a specific time, but the prevalence will be influenced by both the rate at which new cases are occurring (incidence) and the average duration of the disease. Incidence reflects the rate at which new cases of disease are being added to the population (and becoming prevalent cases). Average duration of disease is also important, because the only way you can stop being a prevalent case is to be cured or to move out of the population or die. A prevalent case stops being a prevalent case if she is cured, and she also is no longer a prevalent case in the population if she dies or moves out of the population.
The relationship can be visualized by thinking of inflow and outflow from a sink.
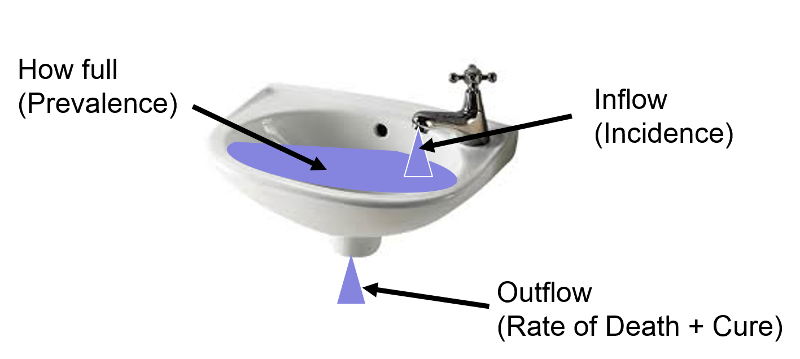
The fullness of the sink (as a percentage) can be thought of as analogous to prevalence, i.e., the proportion or percentage of the population with a given disease at a point in time. The rate at which water flows into the sink represents incidence or the rate at which new cases of a disease are being added to the population; think of each drop added to the sink as a new case. Once new cases are added to the population, they become prevalent cases. Water (i.e., prevalent cases) also can leave via the drain, which is analogous to removal of prevalent cases by virtue of either dying or being cured of the disease; each drop leaving the basin via the drain is no longer a prevalent case by virtue of either dying or being cured.
Now imagine that prevalence of a disease is relatively constant over time because the incidence (inflow from the faucet) and the rate of cure or death (outflow from the drain) are initially equal; if so, the height of water in the reservoir will remain constant.
- If outflow from the sink (rates of cure or death among prevalent cases) remains constant and inflow (incidence of new disease) increases, then the height of water in the reservoir will rise, meaning that prevalence has increased.
- If rates of death and/or cure are constant, and incidence declines, then the water level will fall, i.e. prevalence declines.
Now start from the steady state again.
- if the incidence of disease remains constant, but the rate of death from the disease or the rate of cure increases, then prevalence (fullness of the basin) will decline.
- If incidence remains constant, but the lives of prevalent cases are prolonged, but they aren't cured, then the prevalence will rise.
Example: HIV Prevalence in Kenya from 1990-2006
Prevalence is the proportion of the population with a specific disease at a point in time, but it can be measured at multiple points in time, i.e., serially, as shown in the figure below which displays the prevalence of HIV in Kenya, measured each year from 1990 to 2006.
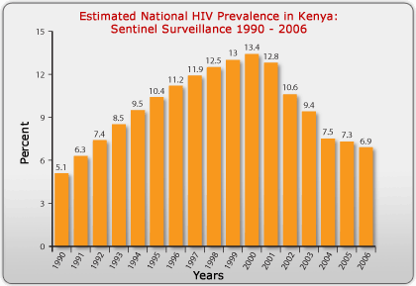
Source: http://www.avert.org/hiv-aids-kenya.htm
The steady increase in prevalence of HIV from 1990 to 2000 was primarily due to the availability of anti-retroviral drugs, which kept those infected with HIV from dying. The antiretrovirals did not cure them, however, so they remained prevalent cases for a longer period of time (i.e., the average duration of disease increased), and the prevalence increased. After the year 2000, the availability of antiretrovirals fell, and the mortality rate from AIDS began to climb again. As a result, the average duration of disease declined, and the prevalence fell.
Several decades ago the average duration of lung cancer was about six months. Therapy was ineffective and almost all lung cancer cases died. From the time of diagnosis, the average survival was only about six months. As a result, the prevalence of lung cancer was fairly low, because the average duration of disease was short. In contrast, diabetes has a long average duration, since it can't be cured, but it can be controlled with medications for many years, so the average duration of diabetes is long, and the prevalence is fairly high.
If the population is initially in a "steady state," meaning that prevalence is fairly constant and incidence and outflow [cure and death] are about equal), then the relationship among these three parameters can be described mathematically as:
Mathematical Relationship Among Prevalence, Incidence, and Average Duration of Disease
If the population is initially in a "steady state," meaning that prevalence is fairly constant and incidence and outflow [cure and death] are about equal), then the relationship among these three parameters can be described mathematically as:

where P= proportion of the population with the disease and (1-P) is the proportion without it, IR is the incidence rate, and "Average duration of disease" is the average time that people have the disease (from diagnosis until they are either cured or die). If the prevalence of disease is low (i.e., <10% of the population has it), then the relationship can be expressed as follows:

![]()
- If the average duration of disease remains constant, then preventive measures that reduce the incidence of disease would be expected to result in a decreased prevalence.
- Similarly, if the incidence remained constant, then developing a cure would reduce the average duration of disease, and this would also reduce the prevalence of disease.
In the late 1990s anti-retroviral therapy was introduced and greatly improved the survival of people with HIV. However, they weren't cured of their disease, meaning that the average duration of disease increased. As a result, the prevalence of HIV increased during this period.
Calculating Average Duration of Disease
The relationship above can be used to calculate average duration of disease under steady state circumstances. If Prevalence = (Incidence) X (Average Duration), then:
Example:
Suppose the incidence rate of lung cancer is 46 new cancers per 100,000 person-years, and the prevalence is 23 per 100,000 population. If so, then,

Individuals with lung cancer survived an average of 6 months from the time of diagnosis
 Test Yourself