


Risk Ratio and Risk Difference
In the example above comparing the incidence of respiratory disease in smokers and non-smokers, the cumulative incidence (risk) of respiratory disease in smokers was 9/10=0.90 (or 90%), while in non-smokers the cumulative incidence (risk) was 7/12=0.58 (or 58%). The ratio of these is the risk ratio, a relative measure of association.
Risk Ratio = CIe/CIu = 0.90/0.58 = 1.55
Interpretation: Smokers had 1.55 times the risk of respiratory disease compared to non-smokers over an 18 year period of observation.
Using the same cumulative incidences we can calculate the risk difference, an absolute measure of association.
Risk Difference = CIe- CIu = 0.90 - 0.58 = 0.32 = 32 per 100
Interpretation: Among smokers there were 32 excess cases of respiratory disease per 100 smokers during the 18 year study.
It is also possible for a risk ratio to be <1 if the exposure is associated with a reduction in risk. In 1982 The Physicians' Health Study (a randomized clinical trial) was begun to test whether low-dose aspirin reduced the risk of myocardial infarctions (heart attacks). The study population consisted of over 22,071 male physicians randomly assigned to either low-dose aspirin or a placebo (an identical looking pill that was inert). They followed these physicians for about five years. Some of the data is summarized in the 2x2 table shown below.
|
Treatment |
Heart Attack |
No Heart Attack |
Total |
|---|---|---|---|
|
Aspirin |
139 |
10,898 |
11,037 |
|
Placebo |
239 |
10,795 |
11,034 |
- With aspirin cumulative incidence = 139/11,037 = 0.0126 = 1.26%
- With placebo cumulative incidence = 239/11,034 = 0.0217 = 2.17%
Risk Ratio = 0.0126/0.0217 = 0.58
Note that the "exposure" of interest was low-dose aspirin, and the aspirin group is summarized in the top row. The group assigned to take aspirin had an incidence of 1.26%, while the placebo (unexposed) group had an incidence of about 2.17%. The cumulative incidence in the aspirin group was divided by the cumulative incidence in the placebo group, and RR= 0.58.
Interpretation: Male physicians who took 325 mg of aspirin every other day had 0.58 times the risk (i.e., a 42% reduction in risk) of myocardial infarction compared to those who received a placebo.
Risk Difference = 0.0126 – 0.0217 = - 0.0091 = - 91/10,000
Note that the index group (i.e., with the exposure of interest) always comes first when computing a measure of association. For a risk ratio the incidence in the group with the exposure of interest is in the numerator, and the incidence for the reference group is in the denominator. For a risk difference the incidence in the reference group is subtracted from the incidence in the group with the exposure of interest.
Also note that the risk difference in the aspirin study was a negative number, again indicating that taking aspirin was associated with a reduction in risk. Interpretation: Male physicians taking 325 mg of aspirin every other day had 91 fewer myocardial infarctions per 10,000 men during the five year study.
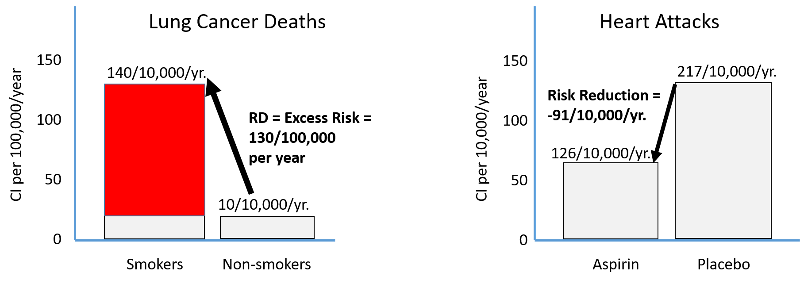
Harmful exposures create excess risk, and preventive measures reduce risk as shown in the figure below. The left side illustrates the excess risk of lung cancer deaths among smokers compared to non-smokers. The right side shows the reduction in risk of heart attack among men taking low-dose aspirin compared to men taking a placebo.
Excess Relative Risk
Suppose a study found that the cumulative incidence of coronary heart disease (CHD) was 3.2/1000 among subjects with hypertension and 1.2/1000 among those without hypertension.
The Risk Ratio = 2.7, and we could interpret this as:
Those with hypertension had 2.7 times the risk of CHD compared to those without hypertension during the study period.
If the risk were equal in the two groups the risk ratio would be 1, so we could also interpret this as an excess relative risk of 170%, i.e., the percent increase in risk compared to the baseline incidence in the reference group.
Those with hypertension had 2.7 times the risk, which is the same as a 170% increase in risk compared to those without hypertension during the study period.
Excess Relative Risk = (RR-1) x 100%
The "Null" Values
The null value is to the measure of association when the incidence is the same in the groups being compared. If this is the case, the risk ratio = 1, the risk difference = 0, and the excess relative risk = 0.