


Issues in the Analysis of Clinical Trials
The Basic Analysis
The basic data analysis is similar to that of a typical cohort study, and the results can be summarized in a contingency table. One can then compute cumulative incidence or incidence rates, as appropriate. From these, one can calculate the risk ratio, risk difference, p-values and 95% confidence intervals. Most of these calculations can be done quite easily using the Excel worksheet for cohort studies provided in "Epi_Tools.XLS". The illustration below shows the results of analysis of a trial looking at the ability of zidovudine (an anti-retroviral drug used in the treatment and prevention of HIV) to reduce maternal to child transmission.
![]()
Data source: Connor EM, et al.: Reduction in maternal-infancy transmission of human immunodeficiency virus type 1 with zidovudine treatment. N. Engl. J. Med. 1994;331:1173-1180, as quoted in the textbook by Aschegrau and Seage in Table 7-5, page 191 in the 2nd edition.)
The analysis to the right resulted in a risk ratio of 0.33 (a 67% reduction in risk) when zidovudine treatment was compared to placebo-treated controls. The 95% confidence interval for the risk ratio was 0.18-0.60. (This was part of protocol 076 referred to above; this trial was the one that originally demonstrated the efficacy of zidovudine in women in the United States and France.)
Did Randomization Control for Confounding?
When analyzing or reading a randomized clinical trial, an important consideration is whether or not randomization actually achieved baseline comparability among the groups. This can be assessed by comparing the groups with respect to their characteristics and potential confounding factors at baseline, i.e., at the beginning of the study.
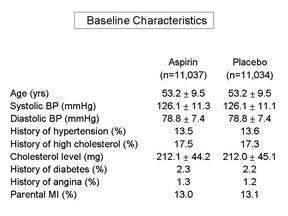
Frequently, a published paper will have an initial table which summarizes the baseline characteristics and compares those using appropriate statistical tests. If the groups are similar with respect to all of these characteristics, then it is more likely that they are similar with respect to other factors as well, and one can assume that randomization was successful. It is important to remember that we can never really know whether randomization was truly successful, because we can only judge based on those baseline characteristics that we have measured. We may not have measured all known confounders, and in any case, we can't have measured the unknown ones. Therefore, the larger the sample size, the more confident we can be that the process of randomization, which relies on the "laws" of chance, has worked to balance baseline characteristics.

Pitfall: According to Rothman, an almost universal mistake in the reporting of clinical trials is to determine whether randomization was successful by comparing the baseline characteristics among the groups using a statistical test and p-values to decide whether confounding occurred. However, the extent to which a confounding factor distorts the measure of effect will depend not only on the extent to which it differs among the groups being compared, but also on the strength of association between the confounder and the outcome (i.e., the risk ratio of the confounding factor.)
|
If all baseline characteristics are nearly identical in the groups being compared, then there will be little, if any, confounding. However, if some factors appear to differ, the only effective way to determine whether they caused confounding is to calculate the measure of effect before and after adjusting for that factor using either stratification analysis or regression analysis. If the adjusted measure of association differs from the unadjusted measure by more than about 10%, then confounding occurred, and steps should be taken to adjust for it in the final analysis. Bear in mind that, even with randomization of treatment status, differences in other risk factors can occur, just by chance. If this occurs, the appropriate thing to do is to adjust for the imbalances in the analysis, using either stratification or regression analysis. |

Intention-to-Treat Analysis:
For the primary analysis all subjects should be included in the groups to which they were randomly assigned, even if they did not complete or even receive the appropriate treatment. This is referred to as an "intention to treat" analysis, and it is important because:
- It preserves baseline comparability and provides control of confounding by known and unknown confounders.
- It maintains the statistical power of the original study population.
- Since compliers and non-compliers are likely to differ on important prognostic factors, retention of all subjects in the analysis will reduce bias.
- It reflects efficacy in everyday practice. In real life, people who have been prescribed certain medications or given advice may not comply for the same reasons that subjects fail to comply in a clinical trial. For this reason, an intention to treat analysis may provide a more accurate measure of the potential benefit to be derived from an new therapy.
Efficacy Analysis
If there has been a problem with compliance, the investigators can also conduct an efficacy analysis (sometimes referred to as a 'secondary analysis'), which compares subjects who actually complied with the assigned protocols. In essence, it determines the efficacy of the new therapy under ideal circumstances, i.e., it tests the benefit of taking the therapy as opposed to the alternative. The problem with an efficacy analysis is that the sample size will be smaller, and it does not control for confounding as rigorously as an intention to treat analysis, because the removal of subjects from either or both groups means the original randomization no longer is in place.