Intervention Studies
Clinical Trials
The primary goal of observational studies, e.g., case-control studies and cohort studies, is to test hypotheses about the determinants of disease. In contrast, the goal of intervention studies is to test the efficacy of specific treatments or preventive measures by assigning individual subjects to one of two or more treatment or prevention options. Intervention studies often test the efficacy of drugs, but one might also use this design to test the efficacy of differing management strategies or regimens. There are two major types of intervention studies:
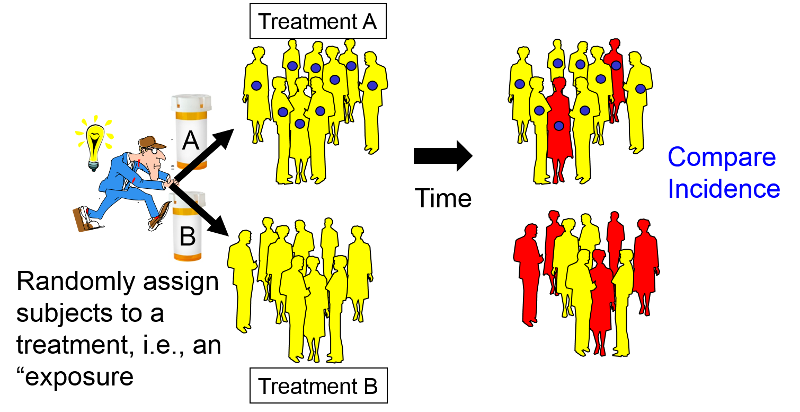
In many respects the design of a clinical trial is analogous to a prospective cohort study, except that the investigators assign or allocate the exposure (treatment) under study.
This provides clinical trials with a powerful advantage over observational studies, provided the assignment to a treatment group is done randomly with a sufficiently large sample size. Under these circumstances randomized clinical trials (RCTs) provide the best opportunity to control for confounding and avoid certain biases. Consequently, they provide the most effective way to detect small to moderate benefits of one treatment over another. However, in order to provide definitive answers, clinical trials must enroll a sufficient number of appropriate subjects and follow them for an adequate period of time. Consequently, clinical trials can be long and expensive.
After successfully completing this section, the student will be able to:

The Kingston-Newburgh Fluoride Trial

Clinical trials might also be distinguished based on whether they are aimed at assessing preventive interventions or evaluating new treatments for existing disease. The Physicians Health Study established that low-dose aspirin reduced the risk of myocardial infarctions (heart attacks) in males. Other trials have assessed whether exercise or low-fat diet can reduce the risk of heart disease or cancer. A study currently underway at BUSPH is testing whether peer counseling is effective in helping smokers who live in public housing quit smoking. All of these are prevention trials. In contrast, there have been many trials that have contributed to our knowledge about optimum treatment of many diseases through medication, surgery, or other medical interventions.
Clinical trials for new drugs are conducted in phases with different purposes that depend on the stage of development.
When clinical trials are performed there is generally a target population or reference population to which one would like to apply the findings. For example, researchers reported on the efficacy of low-dose aspirin in preventing myocardial infarction in women [Ridker P, et al.: A randomized trial of low-dose aspirin in the primary prevention of cardiovascular disease in women. N Engl J Med 2005;352:1293-304]. The reference population was adult females who have not had a myocardial infarction.
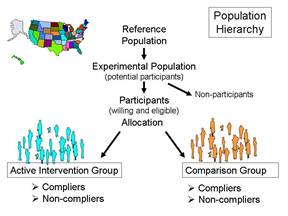
The experimental population (study population) are the potential participants, i.e., a practical subset of people who are representative of the reference population. Important practical considerations might include choosing a group that was sufficiently large and likely to produce an adequate number of end points (outcomes of interest) in order to allow valid statistical analysis and a reasonably precise estimate of the measure of effect. The participants would be those who were willing to participate (i.e., consented after being fully informed about the study) and also met eligibility criteria that take into account scientific and safety considerations. For example, an inclusion criterion might be age 45 or older in order to achieve a study sample that would produce a sufficient number of end points. In a study of the effect of aspirin on cardiovascular disease it would also be important to specify exclusion criteria, e.g., people with pre-existing cardiovascular disease or those who were already taking aspirin or anticoagulants for other medical conditions.
The following is an excerpt from the report by Ridker et al. describing how they obtained their study population:
|
"In brief, between September 1992 and May 1995, letters of invitation were mailed to more than 1.7 million female health professionals. A total of 453,787 completed the questionnaires, with 65,169 initially willing and eligible to enroll. Women were eligible if they were 45 years of age or older; had no history of coronary heart disease, cerebrovascular disease, cancer (except non-melanoma skin cancer), or other major chronic illness; had no history of side effects to any of the study medications; were not taking aspirin or nonsteroidal anti-inflammatory medications (NSAIDs) more than once a week (or were willing to forego their use during the trial); were not taking anticoagulants or corticosteroids;
|
Eligible women were enrolled in a three-month run-in phase of placebo administration to identify a group likely to be compliant with long-term treatment. A total of 39,876 women were willing, eligible, and compliant during the run-in period and underwent randomization: 19,934 were assigned to receive aspirin and 19,942 to receive placebo."
The eligibility criteria need to balance the needs for internal and external validity. Internal validity refers to the accuracy of the conclusions within that particular study sample, while external validity refers to whether or not the results of a particular study are relevant to a more general population. For example, in 1981 the Physicians Health Study sent invitation letters, consent forms, and enrollment questionnaires to all 261,248 male physicians between 40 and 84 years of age who lived in the United States and who were registered with the American Medical Association. Less than half responded to the invitation, and only about 59,000 were willing to participate. Of those 33,223 were both willing and eligible.
These physicians were enrolled in a run-in phase during which all received active aspirin and placebo beta-carotene (both of these were to be tested in a two-by-two factorial design, to be described later in this module). After 18 weeks, participants were sent a questionnaire asking about their health status, side effects, compliance, and willingness to continue in the trial. A total of 11,152 changed their minds, reported a reason for exclusion, or did not reliably take the study pills. The remaining 22,071 physicians were then randomly assigned to experimental groups and followed for the duration of the study. The study was restricted to physicians in order to facilitate follow-up, since all subjects were registered physicians in the AMA. The study excluded female physicians, because in 1981 the number of registered female physicians over the age of 40 was quite small and would not have provided enough statistical power to provide valid results in females. (Note that the exclusion of females is not an example of selection bias. It does not affect the validity of the results of the study but rather the nature of the target population and therefore the generalizability of the results.) The study convincingly demonstrated that the regimen of low-dose aspirin reduced the risk of myocardial infarction (heart attack) in these subjects by about 44%, and the results were reported in 1989 in the New England Journal of Medicine. However, one of the unanswered questions was whether the results were applicable to females (or even to the non-physician population at large). Consequently, the questions about the external validity, i.e. the generalizability, of the study lingered and eventually led to a separate clinical trial in The Women's Health Study. The results were published in 2005 and concluded:
|
"In this large, primary-prevention trial among women, aspirin lowered the risk of stroke without affecting the risk of myocardial infarction or death from cardiovascular causes, leading to a non-significant finding with respect to the primary end point."
Ridker et al.: A randomized trial of low-dose aspirin in the primary prevention of cardiovascular disease in women. N Engl J Med 2005;352:1293-304. |
In other words, the effect of aspirin in preventing myocardial infarctions did appear to be different in women and men.
The major advantage of large randomized clinical trials is that that they are the most effective way to reduce confounding. As such, they offer the opportunity to identify small to moderate effects that may be clinically very important. For example, coronary artery disease (CAD) is the most frequent cause of death and disability in the the US and worldwide. Consequently, interventions that reduce risk by 15-20% would be extremely important, because so much death and disability is attributed to CAD. While control of confounding makes it easier to accurately assess modest but important effects, it is still necessary to have an adequate sample size in order to produce a measure of association that is reasonably precise. If the study does not have a sufficient sample size (i.e., if it is "under powered"), the study might fail to identify a meaningful benefit that truly existed, and much time and money would have been wasted on an incorrect conclusion.
Actually, the key factor influencing the power of the study is the number of outcomes (often referred to as "endpoints") rather than study size per se. Of course, increasing study size will increase the number of endpoints, but two other factors that affect the power of the study are the likelihood of the outcome among the study subjects and the duration of the study. For example, both the Physicians' Health Study and the Women's Health Study required participants to be above the age of 40 at the time of enrollment, since younger subjects would be substantially less likely to have a myocardial infarction during the planned follow up period. The duration of the follow up period is obviously also relevant, since shorter periods of follow up will produce fewer events and reduce statistical power
In order to avoid conducting studies that are underpowered, investigators will perform a series of calculations referred to as sample size estimates. This is not a single calculation, but a series of calculations that, in essence, address "what if" questions. For example, the observational studies that led up to the Physicians Health Study failed to find statistically significant benefits of aspirin, but they seemed to suggest that if there were a benefit, it would likely be on the order of a 15-30% reduction in risk of myocardial infarction. If one has estimates of the magnitude of risk (the expected cumulative incidence) in the reference population, one can than perform calculations to estimate how many subjects one would need in each of two study groups to detect a given effect, if it existed. For example, if the expected incidence of myocardial infarction over five years in males over 40 years of age were around 5%, and if low-dose aspirin truly reduced the risk by about 20%, then the expected frequencies in the untreated placebo group and the aspirin treated group would be expected to be 0.05 and 0.04 respectively. The Excel file "Epi_Tools.XLS" has a worksheet entitled "Sample Size" that performs these calculations for you.
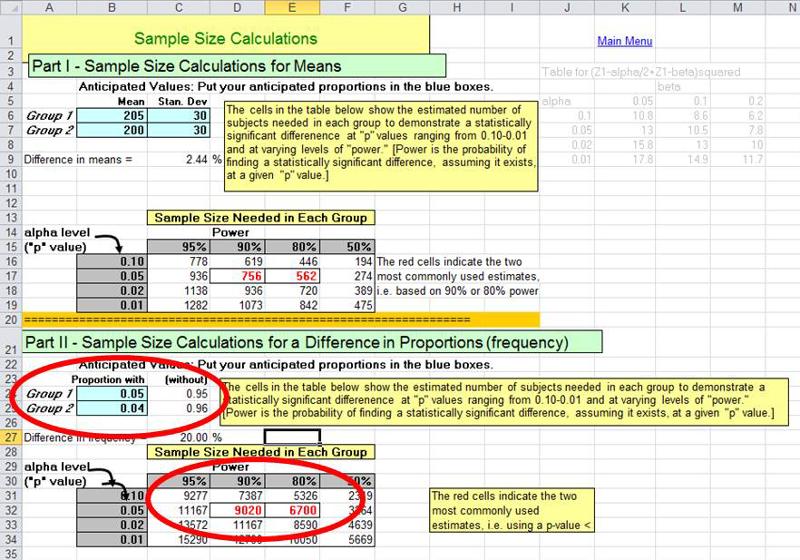
The illustration above shows that a "what if" situation, i.e. what if the frequency of myocardial infarction is 5% without aspirin and 4% with the low-dose aspirin regimen (i.e., a 20% reduction in risk). The calculations indicate that in order to have a 90% probability (statistical power) of finding a statistically significant difference using p<0.05 as the criterion of significance, we would need a little over 9,000 subjects in each group. The investigators in the Physicians' Health Study wisely sought a somewhat larger sample than the estimates indicated.
Many factors can influence whether or not a subject will develop an outcome of interest. As a simple example, consider a study with the goal of determining whether physical activity reduces the risk of heart disease. An overly simplistic approach would be to enroll a cohort of subjects without pre-existing heart disease and divide them into exposure groups based on their activity level at the time of enrollment. They could then be followed longitudinally in order to measure and compare the incidence of heart disease in each group. Both groups would likely have subjects with a range of ages, but the 'active' group would probably have a somewhat younger age distribution than the inactive group, because younger people tend to be more active than older people. The problem, of course, is that age is also an independent risk factor for developing heart disease, so we wouldn't be evaluating just the effect of activity. The "risk" in each group is measured as their cumulative incidence of heart disease, but the risk ratio or risk difference that we measure is really going to reflect the sum total of all differences between the groups that influence their probability of developing heart disease. This would include not only differences in age, but also differences in a host of known (and yet to be discovered) risk factors such as smoking, gender, body mass index, blood pressure, family history, medications used, etc. All of these are factors that influence the risk of heart disease, and they confound our estimation of the association between activity and heart disease.
Confounding distorts the measure of association that is our main concern; in the example above, it is the association between activity and heart disease. However, all of these 'other risk factors' can distort the measure of association we are interested in if they are unevenly distributed among the groups we are comparing. The primary advantage to randomized clinical trials is that random assignment of a sufficiently large number of subjects tends to result in similar distributions of all other factors, including factors unknown to us, among the groups. If the groups have the same distributions of all of these other risk factors at baseline (i.e., the beginning of the trial) then they will not distort our estimate of effect (measure of association).
The distinguishing feature of an intervention study is that the investigators assign subjects to a treatment (or "exposure") in order to establish actively treated groups of subjects and a comparison group. There are several means of assigning exposure for the purposes of comparison, many of which do not, in fact, randomly assign subjects to different groups or have too few subjects to rely on the randomization process to balance factors between groups.
|
Importantly, it is the number of units randomized, not the number of people, that determine whether randomization is likely to work. If the study is an individual trial, then the number of subjects equal the number of units. However, in a group-randomized trial, the number of units is smaller than the number of individuals in the trial. For example, in the trial of peer counseling for smokers in public housing, entire public housing developments were assigned to either the intervention or control arm, so that every participant at a particular development received the same treatment. Twenty developments were randomized. The likelihood that the 10 developments in each arm were balanced on potential confounding factors was the same as if the study consisted of 20 individuals (or the same as the likelihood that flipping a coin 20 times would produce a balanced number of heads and tails), even though there were 500 individuals in the study. In the fluoride trial described previously, even though tens of thousands of people were involved, there were only two cities, and randomization can never balance confounders between two units, whether they are individuals or groups. However, in both these cases, random assignment did avoid the possibility that the investigators would consciously or unconsciously assign the groups based on their feeling about what would be most likely to produce a result consistent with their hypothesis.
Blinding (or masking) refers to withholding knowledge about treatment assignment from subjects and/or investigators in order to prevent bias in assessment of subjective outcomes, such as pain relief. There are several schemes for blinding:
Blinding is facilitated by the use of placebo treatments or sham procedures. For example, in a study designed to evaluate the efficacy of arthroscopic surgery in treating painful osteoarthritis of the knee, subjects in the sham surgery group had a small incision placed on the knee under sedation, but arthroscopic surgery was not actually performed. Instead, the surgeons simulated the procedure by asking to be given the usual instruments and manipulating the knee of the subject as if the real procedure were being performed. Sham surgery is more problematic than use of a placebo, because it has the potential for causing harm and because the patient is being actively deceived. (For a detailed discussion on the ethics of sham surgeries, see Miller FG and Kaptchuk TJ: Sham procedures and the ethics of clinical trials. J R Soc Med. 2004 December; 97(12): 576–578.)
Masking is not always necessary, nor is it always possible. If the primary outcome of interest is definitive and objective, such as death, then masking isn't necessary. In addition, if the treatment is an elaborate surgical procedure, the ethics of doing a sham procedure would be questionable.
The use of placebos and sham procedures facilitates masking and thereby prevents bias in assessment of subjective outcomes, such as pain relief. However, another major advantage to using them is that they enable investigators to distinguish the degree to which improvements are solely the result of the "placebo effect." When people are enrolled in a study, or prescribed a medication or offered any medical treatment or care, there is generally an expectation that they will improve or benefit from it. The tendency for people to report improvements even when the treatment has no real therapeutic effect is referred to as "the placebo effect," and it can vary widely in magnitude. In a clinical trial designed to test the effectiveness of glucosamine and chondroitin in relieving symptoms of osteoarthritis the authors defined the outcome of interest as greater than 20% relief of pain on an analog scale, shown below.
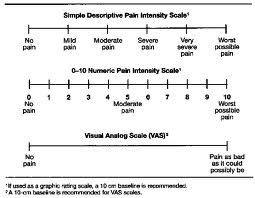
In the placebo treated group, 60% reported greater than 20% relief of pain, compared to 67% in the group treated with glucosamine and chondroitin.
Another illustration of the potential impact of the placebo effect is seen in the article below from the New York Times.
|
Perceptions: Positive Spin Adds to a Placebo's Impact By NICHOLAS BAKALAR, New York Times, December 27, 2011 In a study published online last week in the online journal PLoS One, researchers explained to 80 volunteers with irritable bowel syndrome that half of them would receive routine treatment and the other half would receive a placebo. They explained to all that this was an inert substance, like a sugar pill, that had been found to "produce significant improvement in I.B.S. symptoms through mind-body self-healing processes." The patients, all treated with the same attention, warmth and empathy by the researchers, were then randomly assigned to get the pill or not. At the end of three weeks, they tested all the patients with questionnaires assessing the level of their pain and other symptoms. The patients given the sugar pill — in a bottle clearly marked "placebo" — reported significantly better pain relief and greater reduction in the severity of other symptoms than those who got no pill. The authors speculate that the doctors' communication of a positive outcome was one factor in the apparent effectiveness of the placebo. |
Does Sugar Make Kids Hyperactive?
Watch this short video.
Non-compliance is the failure to adhere to the study protocol. For example, in the Physicians Health Study about 15% of the subjects randomized to receive low-dose aspirin did not regularly take the capsules they received, and about 15% of the subjects in the placebo group were actually taking aspirin on a fairly regular basis.
Non-compliance tends minimize any difference between the groups. As a result, the statistical power to detect a true difference is reduced, and the true effect will be biased toward the null.
Even when measures are taken to maximize compliance, it is important to assess compliance in the participants.
Follow up on subjects can be accomplished through periodic visits and examinations, by phone interviews, by mail questionnaires, or via the Internet. Patients may drop out of a study as a result of loss or interest, adverse reactions, or simple a burdensome protocol that becomes tiring. Others might become lost to follow up because of death, relocation or other reasons. Loss to follow up is a problem for two main reasons:
The basic data analysis is similar to that of a typical cohort study, and the results can be summarized in a contingency table. One can then compute cumulative incidence or incidence rates, as appropriate. From these, one can calculate the risk ratio, risk difference, p-values and 95% confidence intervals. Most of these calculations can be done quite easily using the Excel worksheet for cohort studies provided in "Epi_Tools.XLS". The illustration below shows the results of analysis of a trial looking at the ability of zidovudine (an anti-retroviral drug used in the treatment and prevention of HIV) to reduce maternal to child transmission.
![]()
Data source: Connor EM, et al.: Reduction in maternal-infancy transmission of human immunodeficiency virus type 1 with zidovudine treatment. N. Engl. J. Med. 1994;331:1173-1180, as quoted in the textbook by Aschegrau and Seage in Table 7-5, page 191 in the 2nd edition.)
The analysis to the right resulted in a risk ratio of 0.33 (a 67% reduction in risk) when zidovudine treatment was compared to placebo-treated controls. The 95% confidence interval for the risk ratio was 0.18-0.60. (This was part of protocol 076 referred to above; this trial was the one that originally demonstrated the efficacy of zidovudine in women in the United States and France.)
When analyzing or reading a randomized clinical trial, an important consideration is whether or not randomization actually achieved baseline comparability among the groups. This can be assessed by comparing the groups with respect to their characteristics and potential confounding factors at baseline, i.e., at the beginning of the study.
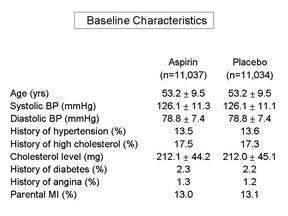
Frequently, a published paper will have an initial table which summarizes the baseline characteristics and compares those using appropriate statistical tests. If the groups are similar with respect to all of these characteristics, then it is more likely that they are similar with respect to other factors as well, and one can assume that randomization was successful. It is important to remember that we can never really know whether randomization was truly successful, because we can only judge based on those baseline characteristics that we have measured. We may not have measured all known confounders, and in any case, we can't have measured the unknown ones. Therefore, the larger the sample size, the more confident we can be that the process of randomization, which relies on the "laws" of chance, has worked to balance baseline characteristics.

Pitfall: According to Rothman, an almost universal mistake in the reporting of clinical trials is to determine whether randomization was successful by comparing the baseline characteristics among the groups using a statistical test and p-values to decide whether confounding occurred. However, the extent to which a confounding factor distorts the measure of effect will depend not only on the extent to which it differs among the groups being compared, but also on the strength of association between the confounder and the outcome (i.e., the risk ratio of the confounding factor.)
|
If all baseline characteristics are nearly identical in the groups being compared, then there will be little, if any, confounding. However, if some factors appear to differ, the only effective way to determine whether they caused confounding is to calculate the measure of effect before and after adjusting for that factor using either stratification analysis or regression analysis. If the adjusted measure of association differs from the unadjusted measure by more than about 10%, then confounding occurred, and steps should be taken to adjust for it in the final analysis. Bear in mind that, even with randomization of treatment status, differences in other risk factors can occur, just by chance. If this occurs, the appropriate thing to do is to adjust for the imbalances in the analysis, using either stratification or regression analysis. |
For the primary analysis all subjects should be included in the groups to which they were randomly assigned, even if they did not complete or even receive the appropriate treatment. This is referred to as an "intention to treat" analysis, and it is important because:
If there has been a problem with compliance, the investigators can also conduct an efficacy analysis (sometimes referred to as a 'secondary analysis'), which compares subjects who actually complied with the assigned protocols. In essence, it determines the efficacy of the new therapy under ideal circumstances, i.e., it tests the benefit of taking the therapy as opposed to the alternative. The problem with an efficacy analysis is that the sample size will be smaller, and it does not control for confounding as rigorously as an intention to treat analysis, because the removal of subjects from either or both groups means the original randomization no longer is in place.
Many reports of epidemiologic studies focus on the strength of association, i.e., risk ratios and rate ratios. However, when trying to weigh decisions for an individual person it it important to consider:
Is Low Dose Aspirin Beneficial?
A number of descriptive studies suggested that people who took aspirin regularly seemed to have a lower risk of myocardial infarction (heart attack). Observational studies suggested perhaps a 30% reduction in risk of myocardial infarction, but of course the subjects were not randomized, so there were concerns about unrecognized confounding. Several small clinical trials suggested similar reductions, but the sample sizes were too small to arrive at a solid conclusion. In the early 1980s The Physician's Health Study was conducted to test the hypothesis that 325 mg. of aspirin (one 'adult' sized aspirin) taken every other day would reduce mortality from cardiovascular disease (N. Engl. J. Med. 320:1238, 1989). Male physicians 40 to 84 years of age living in the US in 1980 were eligible to participate. Physicians were excluded if they had a personal history of myocardial infarction, stroke or transient ischemic attack; cancer; current gout; liver, renal or peptic ulcer disease; contraindication to aspirin consumption; current use of aspirin, platelet-active drugs or non-steroidal anti-inflammatory agents; intolerance to aspirin; or inability to comply with the protocol. Eligible subjects who met the inclusion criteria and who successfully completed a run-in phase were randomly assigned to receive aspirin or a placebo. Eventually 22,071 physicians were enrolled; 11,037 were assigned to aspirin, and 11,034 were assigned to placebo. The agents (aspirin and placebo) were identical in appearance and were mailed to the subjects. The recipients' treatment group was coded, and neither the subject nor the investigators knew which treatment group a given subject was in. The table below summarizes the number of 'events' that had occurred in each treatment group after about 5 years of follow up. The primary outcome of interest was myocardial infarction, but possible adverse effects of chronic aspirin use, such as stroke, ulcer disease, and bleeding problems were also recorded.
|
Endpoints |
Aspirin Group |
Placebo Group |
|---|---|---|
|
|
(N=11,037) |
(N=11,034) |
|
Myocardial Infarction |
|
|
|
Fatal MI |
10 |
26 |
|
Non-fatal MI |
129 |
213 |
|
Total MI |
139 |
239 |
|
Ischemic Stroke |
91 |
82 |
|
Hemorrhagic Stroke |
23 |
12 |
|
Upper Gastrointestinal Ulcer |
169 |
138 |
|
Upper GI ulcer with bleeding |
38 |
22 |
|
Bleeding Problems |
2,979 |
2,249 |
|
Bleeding requiring blood transfusion |
48 |
28 |
The data clearly show a substantial decrease in the occurrence of both fatal and non-fatal myocardial infarctions among those randomized to aspirin compared to placebo. However, there also were an increased number of hemorrhagic strokes, ulcers, and bleeding problems. These results were controversial at the time. Most of the investigators wanted to continue the study to clarify whether there was an increased risk of stroke. However, the data safety and monitoring board for the study strongly recommended that the study be terminated, because the benefit of aspirin had been clearly demonstrated, and they felt it was unethical to withhold its use from half of the participants.
As an exercise, you can calculate the risk ratios comparing the aspirin and placebo groups on the different outcomes. How much do the risk ratios help you weigh the benefits and risks of aspirin therapy.


Your recommendations?
Based on the results of your analysis, what recommendations would you make regarding the benefits and risks of this regimen with low dose aspirin? Write down your recommendations, based on your analysis of this data, regarding the use of low dose aspirin.
An alternative approach?
Before you look at the feedback, consider whether there is an alternate way of looking at the data in the table. Would an alternate approach offer any advantages in weighting the risks and benefits?
Feedback
For "A" Students - Another Useful Tool for Weighing Risk/Benefit
When thinking about the potential benefit of competing treatment options, one has to consider both the effectiveness of therapy and its cost. An interesting way to think about this is to calculate the number of people you would need to treat in order to prevent one adverse outcome. If you also know the cost of treatment, it is easy to calculate the cost of preventing one adverse outcome with a given treatment or preventive strategy. If you were to calculate this for competing preventive strategies, you would have a convenient way of comparing their cost effectiveness.
You already have the tools to do this. Suppose you were interested in preventing cardiovascular disease in people who were classified as having an increased risk. Statins are a class of drugs that have been demonstrated to be effective in lowering blood levels of cholesterol and significantly reducing the incidence of major cardiac events (heart attack, stroke, severe angina) in patients with elevated cholesterol levels. However, certain groups of people who do not have elevated cholesterol levels are still at increased risk of having a major cardiac event, including people who have elevations in an inflammatory marker called C-reactive protein. In Nov. 2008 the New England Journal of Medicine published the results of a study in which the investigators enrolled 17,802 subjects who had no history of heart disease. All subjects had elevated levels of C-reactive protein, but they all had normal cholesterol levels. Subjects were randomly assigned to receive either the statin Rosuvastatin (Crestor) 20 mg. per day or a placebo that looked identical to the active agent. The drugs were coded, and neither the investigators nor the subjects know who was receiving the active drug. Subjects were followed for an average duration of about two years.
Several points from the Methods section of the paper:
Other important information: CanadianDrugs.com is has been selling 20 mg. Crestor for about $2.00 (US) per pill (i.e., $2.00 per day to treat). This was the lowest cost source that I was able to identify.
The following table summarizes the main findings of the study.
| Group |
Subjects |
Major Cardiac Events |
Person-years at risk |
|---|---|---|---|
|
Crestor (a statin) |
8,901 |
142 |
18,442 |
|
Placebo |
8,901 |
251 |
18,529 |
One could easily compute the rate ratio:
Rate Ratio = (142/18,442) / (251/18,529) = 0.57
The 95% confidence interval for the rate ratio is 0-46-0.70, and the p-value < 0.00001.
However, to evaluate cost versus benefit, it would be more useful to consider how much it costs to prevent a single major cardiovascular 'event.' How would you compute this from the data shown in the table and knowing that the cost of Crestor therapy is about $2.00 per day?
One can easily compute this from the rate difference:
Rate Difference = (142/18,442) - (251/18,529) = - 0.005847 per person-year
Since the result is a negative number, I can interpret this as a reduction in risk of about 58 major cardiovascular events among 10,000 treated persons over a year. In other words, if we treated 10,000 such subjects with statins for one year, we could expect to prevent 58 major CVD events.
Another way of thinking the rate difference is to consider how many people one would have to treat for a year in order to prevent a single CVD event. This is often referred to as the "number needed to treat" or NNT.
If 10,000 treated subjects prevented 58.47 events, then the number that would need to be treated to prevent one event is
NNT = 10,000 treated for a year / 58.47 = 171 treated for one year to prevent one event
Note that the NNT is simply the reciprocal of the rate difference for a year, and note also that NNT is conveniently calculated for you in EpiTools.XLS in the worksheet for cohort.-type studies.
Rate difference = 58.47 / 10,000 over a year
NNT = 10,000 over a year / 58.47 = 171
Finally, if one needs to treat 171 people for a year to prevent one major CVD event, then the cost of preventing one such event is:
171 x $2.00/day x 365 days = $124,830 per year to prevent one major event
And the cost of treating 10,000 such persons would be $7,300,000 per year.
With these calculations in mind, consider the management of a 50 year old who has normal cholesterol levels, but elevated C-reactive protein. This individual would, of course, have to be treated for many years. Would you support or recommend long term treatment of such individuals with Crestor? Why or why not?
