


The Standard Normal Distribution
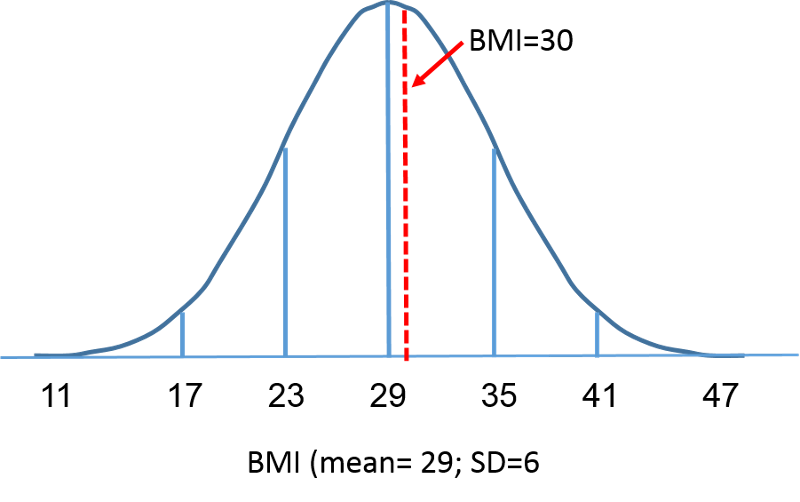
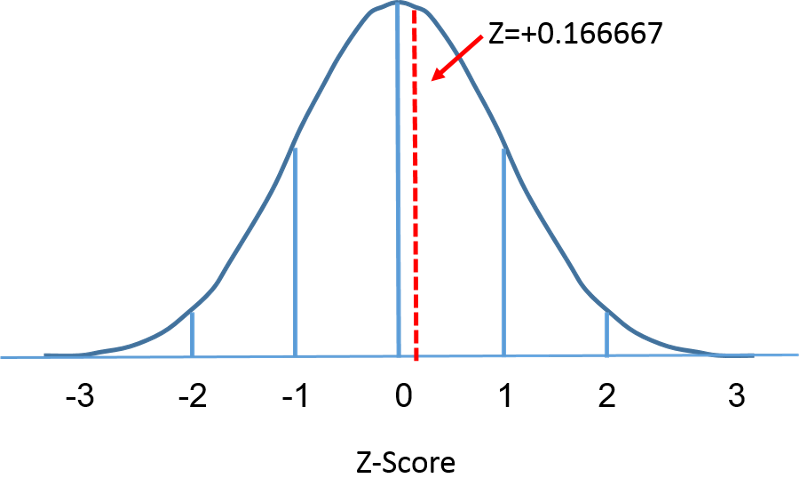
The standard normal distribution is a normal distribution with a mean of zero and standard deviation of 1. The standard normal distribution is centered at zero and the degree to which a given measurement deviates from the mean is given by the standard deviation. For the standard normal distribution, 68% of the observations lie within 1 standard deviation of the mean; 95% lie within two standard deviation of the mean; and 99.9% lie within 3 standard deviations of the mean. To this point, we have been using "X" to denote the variable of interest (e.g., X=BMI, X=height, X=weight). However, when using a standard normal distribution, we will use "Z" to refer to a variable in the context of a standard normal distribution. After standarization, the BMI=30 discussed on the previous page is shown below lying 0.16667 units above the mean of 0 on the standard normal distribution on the right.
 ====
====
Since the area under the standard curve = 1, we can begin to more precisely define the probabilities of specific observation. For any given Z-score we can compute the area under the curve to the left of that Z-score. The table in the frame below shows the probabilities for the standard normal distribution. Examine the table and note that a "Z" score of 0.0 lists a probability of 0.50 or 50%, and a "Z" score of 1, meaning one standard deviation above the mean, lists a probability of 0.8413 or 84%. That is because one standard deviation above and below the mean encompasses about 68% of the area, so one standard deviation above the mean represents half of that of 34%. So, the 50% below the mean plus the 34% above the mean gives us 84%.
Probabilities of the Standard Normal Distribution Z
![]()
This table is organized to provide the area under the curve to the left of or less of a specified value or "Z value". In this case, because the mean is zero and the standard deviation is 1, the Z value is the number of standard deviation units away from the mean, and the area is the probability of observing a value less than that particular Z value. Note also that the table shows probabilities to two decimal places of Z. The units place and the first decimal place are shown in the left hand column, and the second decimal place is displayed across the top row.
But let's get back to the question about the probability that the BMI is less than 30, i.e., P(X<30). We can answer this question using the standard normal distribution. The figures below show the distributions of BMI for men aged 60 and the standard normal distribution side-by-side.
Distribution of BMI and Standard Normal Distribution
====
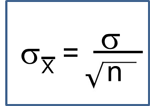
The area under each curve is one but the scaling of the X axis is different. Note, however, that the areas to the left of the dashed line are the same. The BMI distribution ranges from 11 to 47, while the standardized normal distribution, Z, ranges from -3 to 3. We want to compute P(X < 30). To do this we can determine the Z value that corresponds to X = 30 and then use the standard normal distribution table above to find the probability or area under the curve. The following formula converts an X value into a Z score, also called a standardized score:


where μ is the mean and σ is the standard deviation of the variable X.
In order to compute P(X < 30) we convert the X=30 to its corresponding Z score (this is called standardizing):
Thus, P(X < 30) = P(Z < 0.17). We can then look up the corresponding probability for this Z score from the standard normal distribution table, which shows that P(X < 30) = P(Z < 0.17) = 0.5675. Thus, the probability that a male aged 60 has BMI less than 30 is 56.75%.
Another Example
Using the same distribution for BMI, what is the probability that a male aged 60 has BMI exceeding 35? In other words, what is P(X > 35)? Again we standardize:
We now go to the standard normal distribution table to look up P(Z>1) and for Z=1.00 we find that P(Z<1.00) = 0.8413. Note, however, that the table always gives the probability that Z is less than the specified value, i.e., it gives us P(Z<1)=0.8413.
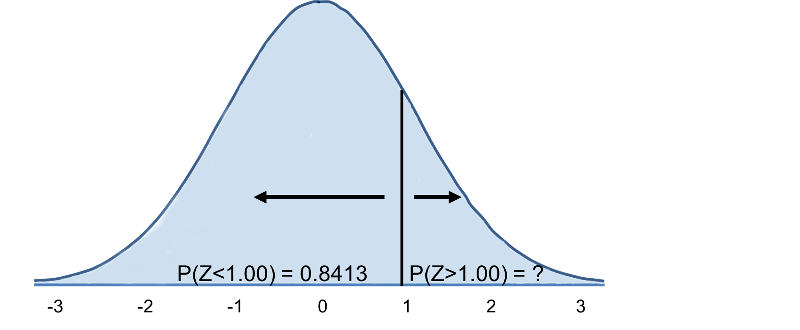
Therefore, P(Z>1)=1-0.8413=0.1587. Interpretation: Almost 16% of men aged 60 have BMI over 35.
Normal Probability Calculator
![]()
![]()
Z-Scores with R
As an alternative to looking up normal probabilities in the table or using Excel, we can use R to compute probabilities. For example,
> pnorm(0)
[1] 0.5
A Z-score of 0 (the mean of any distribution) has 50% of the area to the left. What is the probability that a 60 year old man in the population above has a BMI less than 29 (the mean)? The Z-score would be 0, and pnorm(0)=0.5 or 50%.
What is the probability that a 60 year old man will have a BMI less than 30? The Z-score was 0.16667.
> pnorm(0.16667)
[1] 0.5661851
So, the probabilty is 56.6%.
What is the probability that a 60 year old man will have a BMI greater than 35?
35-29=6, which is one standard deviation above the mean. So we can compute the area to the left
> pnorm(1)
[1] 0.8413447
and then subtract the result from 1.0.
1-0.8413447= 0.1586553
So the probability of a 60 year ld man having a BMI greater than 35 is 15.8%.
Or, we can use R to compute the entire thing in a single step as follows:
> 1-pnorm(1)
[1] 0.1586553
Probability for a Range of Values

What is the probability that a male aged 60 has BMI between 30 and 35? Note that this is the same as asking what proportion of men aged 60 have BMI between 30 and 35. Specifically, we want P(30 < X < 35)? We previously computed P(30<X) and P(X<35); how can these two results be used to compute the probability that BMI will be between 30 and 35? Try to formulate and answer on your own before looking at the explanation below.
Now consider BMI in women. What is the probability that a female aged 60 has BMI less than 30? We use the same approach, but for women aged 60 the mean is 28 and the standard deviation is 7.
What is the probability that a female aged 60 has BMI exceeding 40? Specifically, what is P(X > 40)?