


Summary of Multiple Linear Regression
Multiple linear regression is used to evaluate predictors for a continuously distributed outcome variable. The procedure calculates coefficients for each of the independent variables (predictors) that best agree with the observed data in the sample.
Multiple variable regression enables you to:
- Control for confounding: each of the coefficients for the independent variables is adjusted for confounding by all other variables in the model.
- Make predictions: Predicted values from the model can be interpreted either as estimated means (for subjects with a particular profile) or as predictions for individuals.
- Identify relative importance of the independent variables in the model outcome
Interpretation:
- First, determine whether the overall p-value indicates that this particular set of predictors are significantly associated with the outcome.
- If so, one can evaluate the relative impact of individual variables (which are adjusted for the other variables) based on slope, confidence intervals for slope, & p-value for slope.
- What is the multiple R-squared? How much variability does the model explain?
 Test Yourself
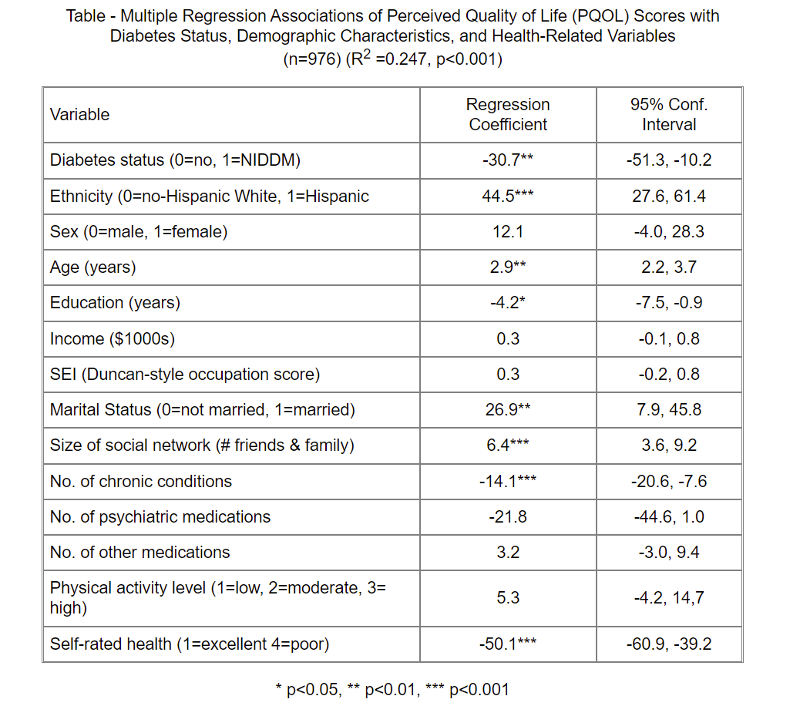
A study was conducted to evaluate the association between quality of life and non-insulin-dependent diabetes mellitus (NIDDM) status, and whether this association differs between Hispanics and non-Hispanic Whites. Between 1986 and 1989, cross-sectional data on perceived quality of life (PQOL) were collected from 223 persons with NIDDM and 753 non-diabetic subjects.
What would you conclude regarding the results of multiple linear regression analysis summarized in the table below? How would you summarize these findings for a general audience? Remember that the regression coefficients can be thought of as slopes with a null value=0.
Table - Multiple Regression Associations of Perceived Quality of Life (PQOL) Scores with
Diabetes Status, Demographic Characteristics, and Health-Related Variables
(n=976) (R2 =0.247, p<0.001)

Test Yourself
A prospective cohort study was conducted in the women and children's clinic at Boston City Hospital from 1984 to 1987 to determine the effects of maternal use of tobacco, alcohol, marijuana, cocaine, and other drugs during pregnancy. Exposures were assessed during pregnancy in 1,226 women using questionnaires and urine tests for cocaine and marijuana. The primary outcome was birth weight of their baby. [Zuckerman B, et al.: Effects of Maternal Marijuana and Cocaine Use on Fetal Growth, N. Engl. J. Med. 1989; 320:762-768]
A t-test for independent samples found that babies born to mothers who used cocaine during pregnancy weighed on average 407 grams less than babies born to mothers who did not use cocaine. However, mothers who use cocaine during pregnancy differed from non-users in a number of other ways that could cause confounding. Cocaine users were also more likely to smoke cigarettes and drink alcohol during pregnancy, and they were more likely to have sexually transmitted infections during their pregnancy.
The investigators conducted a multiple linear regression with the following results:
Note that the data for gestational age and maternal age were not normally distributed, so the investigators used log transformations to normalize the data.
Variable Coefficient p-value
Gestational age (log) 6452 .001
Maternal age (log) -85 .210
Maternal weight gain (lb.) 7 .001
Hispanic vs Black 106 .004
White vs Black 199 .001
Primipara (1st pregnancy) -141 .001
Number of prenatal visits 16 .001
Cocaine use(1=yes; 0=no) -93 .070
R2 = 0.51
Interpret these results with respect to:
- The R-squared for the model
- Ethnic differences in birth weight (grams)?
- The association between prenatal care visits and birth weight
- The association between cocaine use and birth weight
Test Yourself
A clinical trial was conducted to investigate the efficacy of antenatal corticosteroids in reducing neonatal morbidity in women at risk for preterm delivery.
The primary outcome was a composite including any of the following: respiratory distress syndrome, bronchopulmonary dysplasia, severe intraventricular hemorrhage, sepsis and perinatal death. However, for this exercise we will focus on birth weight, which was one of the continuous outcome outcomes.
The data are posted in a file called "Steroids_rct.csv", which you can download from the data set folder on Blackboard. The variables are named and codes are as follows:
Variable Coded as:
treatment 1=steroids; 0=placebo
malesex 1=male; 0=female
gestage gestational age (in weeks)
birthweight Weight of the infant at birth in grams
mat_age maternal age in years
outcome 1=yes; 0=no
- Do a crude (unadjusted) analysis to determine whether birthweight differed between treated and untreated mothers. What was the difference in birthweight by treatment group?
- Determine whether birthweight differed between treated and untreated mothers after adjusting for gestational age, maternal age and infant sex.