
Using proc freq to Perform Chi-Square Tests
Example:
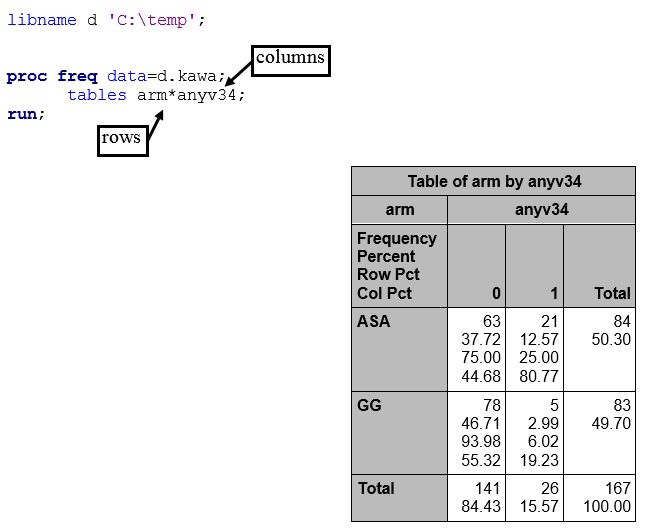
The Kawasaki study data are in a SAS data set with 167 observations (one for each child) and three variables, an ID number, treatment arm (GG or ASA), and an indicator variable for any CA abnormality at visit 3 or visit 4.
The ORDER= Option
The PROC FREQ statement has an option that defines the order in which values appear in frequencies and crosstabs generated by PROC FREQ.
The default is ORDER=INTERNAL, which means that data is ordered (alphabetically or numerically) by the unformatted values of the data. For example, the ARM variable in the above example takes on a value of 'ASA' or 'GG,' and thus, by default, the ASA values will appear before the GG values in the PROC FREQ output.
The option ORDER=FORMATTED will order the data by (ascending) formatted values of variables. The impacts of other ORDER= options are given at the end of this module.
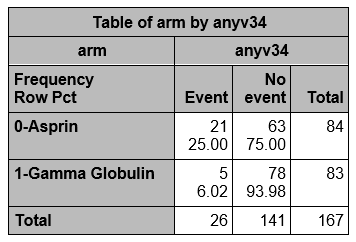
Formatting the outcome so that the event is in the first column
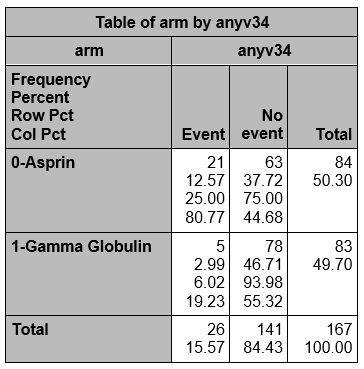
Using the format below, since "E" comes before "N" alphabetically, "Event" will be in column 1 and "No event" in column 2. However, ASA will be in row 1 since ASA is formatted "0-Aspirin" and GG is formatted "1-Gamma Globulin".
proc format;
value $armf "ASA"="0-Aspirin" "GG"="1-Gamma Globulin";
value eventf 0='No event' 1='Event';
run;
proc freq data=d.kawa; order=formatted;
format arm $armf. anyv34 eventf.;
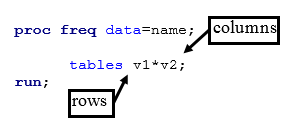
tables arm*anyv34;
run;
Other Options
We can keep including a format statement in each proc but let's instead format them in a data step.
data one;set d.kawa;
format arm $armf. anyv34 eventf.;
There are several options that can be included after a / in the TABLE statement.
- The norow, nocol,and nopercent options restrict the number of entries in the table.
- The measures option estimates the odds ratio and the relative risk with their accompanying confidence intervals.
- The chisq option requests the chi-square test. The expected option requests the expected cell frequencies be included in the cells. A warning displayed in the output if more than 20% of the cells have expected counts of less than 5.
Suppressing the Column and Overall Percentage
proc freq data=one order=formatted;
tables arm*anyv34 / nocol nopercent;
run;
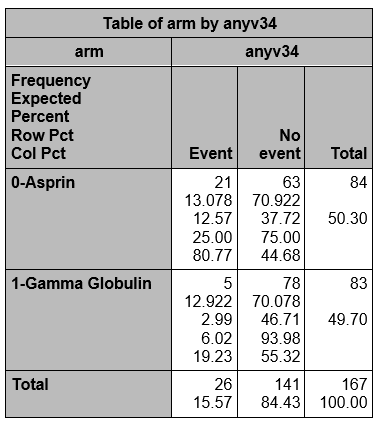
Including Expected Frequencies
proc freq data=one order=formatted;
tables arm*anyv34 / expected ;
run;
Requesting the Chi Square Test
proc freq data=one order=formatted;
tables arm*anyv34 / chisq ;
run;
The 2 x 2 table is produced as above, plus the following output.
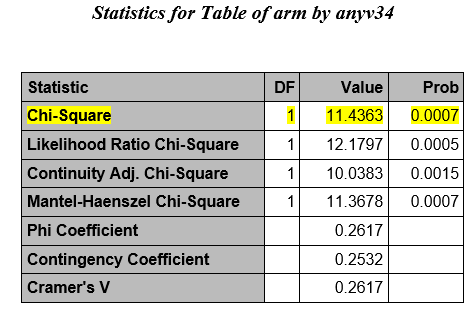
The highlighted row contains the chi square statistic and its associated p-value
|
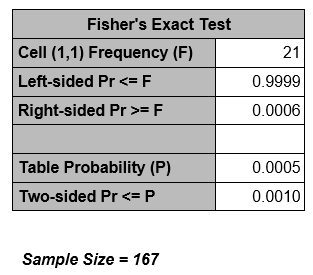
Note: If > 20% of the cell frequencies are <5, SAS will print a warning, and you should not use the chi-square test. Instead, use the Two-sided Fisher's Exact Test (printed by default when the table is 2 x 2). |