

A Compact Way to Import Data for Chi-Square Tests
NOTE: All of the analyses shown above assume that data are in a file with one observation per person. To instead perform an analysis with data from an existing table input the observed cell frequencies and use a weight statement with the weight equal to the cell frequency.
Example (Kawasaki data)
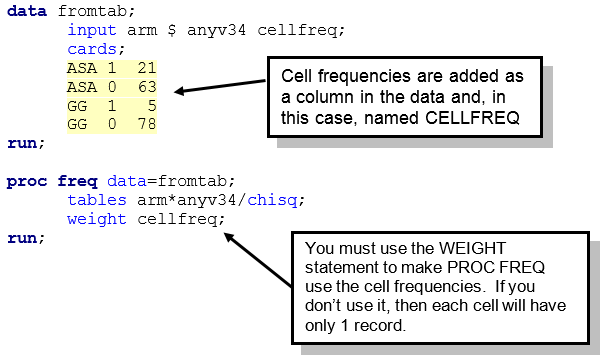
This will produce the same output as we found above.
R x C Tables
Chi-square tests can also be used for for R x C tables
H0: the two categorical variables are independent.
H1: the two categorical variables are not independent
The chi squared test can be used just as above, with the expected frequencies calculated in a similar fashion.

where the sum is computed over the RxC cells in the table. As long as no more than 20% of the cells have expected frequencies < 5, the computed chi-square value may be compared to the critical chi-square value with (R-1)(C-1) degrees of freedom (df) and a pre-specified level of significance (α).
Reject if ![]()
Example:
Suppose you have a data set in which people are classified by hair and eye color but with three hair colors and two eye colors. You test
H0: Hair and eye color are independent.
H1: Hair and eye color are not independent
data one;
input haircolor $ eyecolor $;
cards;
brown blue
.
blond blue
;
proc freq;tables haircolor*eyecolor/chisq;run;
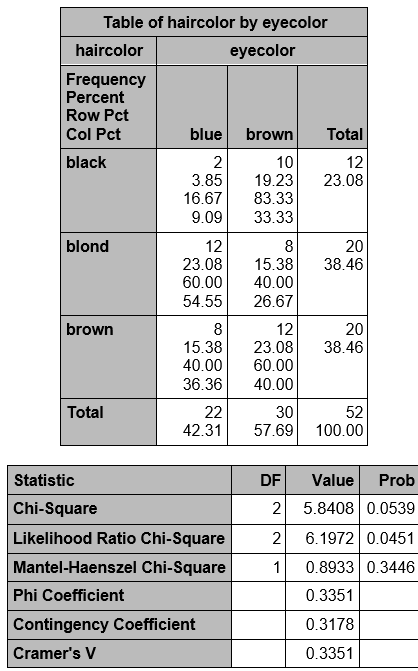
Notice that df = (3-1)x(2-1) = 2. We did not explicitly check the expected frequencies, but SAS did not warn us that they were not sufficient, so we can use the test. Using the table at the end of this lecture, we see the critical value of χ2 with 2 degrees of freedom, and α = 0.05 is 5.99. The χ2 statistic = 5.8408 which is just less than the critical value, so we do not reject Ho. Alternatively, we can compare p to α = 0.05. Here, p = 0.0539, which >0.05 and we do not reject Ho. We conclude that we do not have enough evidence to say that hair and eye color are not independent.
Example:
Suppose you have yet another data set in which people are classified by hair and eye color but with three levels of hair color and three levels of eye color.
proc freq;tables haircolor*eyecolor/chisq expected nocol nopercent;run;
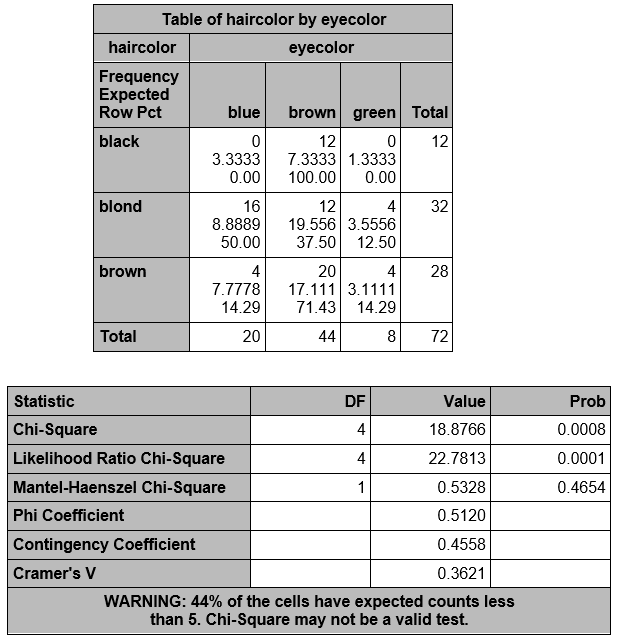
Here we are warned that the chi square test may not be valid, because 44% of the expected counts are < 5. Notice that 5 of the 9 cells (55%) have observed counts <5, but that is not relevant.
One option is to combine levels. Here we can combine black and brown hair or we can combine blue and green eyes. Let's combine levels of eye color.
data two;set one;
length new_eyecolor $ 10;
new_eyecolor=eyecolor;
if eyecolor in ('blue','green') then new_eyecolor='blu-grn';
proc freq;tables haircolor*new_eyecolor/chisq;run;
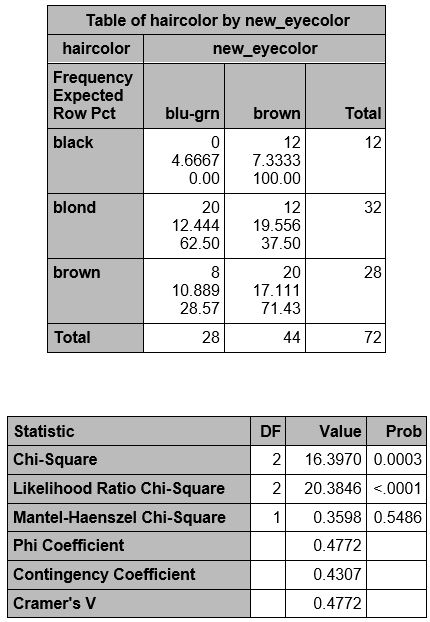
Now, there is only 1 of 6 (16%) cells with expected frequency <5, so the chi square test is valid.
df = (3-1)x(2-1) = 2. The χ2 statistic = 16.3970 and p = 0.0003, so we do reject Ho and conclude that we have evidence that hair and eye color are not independent.