

Paired t-test
A paired t-test is used when we are interested in the difference between two variables for the same subject.
Often the two variables are separated by time. For example, in the Dixon and Massey data set we have cholesterol levels in 1952 and cholesterol levels in 1962 for each subject. We may be interested in the difference in cholesterol levels between these two time points.
However, sometimes the two variables are separated by something other than time. For example, subjects with h ACL tears may be asked to balance on their leg with the torn ACL and then to balance again on their leg without the torn ACL. Then, for each subject, we can then calculate the difference in balancing time between the two legs.
|
Since we are ultimately concerned with the difference between two measures in one sample, the paired t-test reduces to the one sample t-test. |

Null Hypothesis: H0: μd = 0
Alternative Hypothesis: H1: μd ≠ 0
Point Estimate:![]() (the sample mean difference) is the point estimate of .μd
(the sample mean difference) is the point estimate of .μd
Test statistic:

Note that the standard error of ![]() is
is ![]() where sd is the standard deviation of the differences.
where sd is the standard deviation of the differences.
As before, we compare the t-statistic to the critical value of t (which can be found in the table using degrees of freedom and the pre-selected level of significance, α). If the absolute value of the calculated t-statistic is larger than the critical value of t, we reject the null hypothesis.
Confidence Intervals
We can also calculate a 95% confidence interval around the difference in means. The general form for a confidence interval around a difference in means is
![]()
For a two-sided 95% confidence interval, use the table of the t-distribution (found at the end of the section) to select the appropriate critical value of t for the two-sided α=0.05. .
Example:
Suppose we wish to determine if the cholesterol levels of the men in Dixon and Massey study changed from 1952 to 1962. We will use the paired t-test.
- H0: The average difference in cholesterol is 0 from 1952 to 1962
- H1: The average difference in cholesterol is NOT 0 from 1952 to 1962.
- Our significance level is α = 0.05.

For α = 0.05 and 19 df, the critical value of t is 2.093. Since | -6.7| > 2.093, we reject H0 and state that we have significant evidence that the average difference in cholesterol from 1952 to 1962 is NOT 0. Specifically, there was an average decrease of 69.8 from 1952 to 1962.
Paired t-test Using SAS:
To perform a paired t-test in SAS, comparing variables X1 and X2 measured on the same people, you can first create the difference as we did above, and perform a one sample t-test of:
![]()
data pairedtest; set original;
d=x1-x2;
run;
proc ttest data=pairedtest h0=0;
var d;
run;
Hypotheses:
- H0: The average difference in cholesterol is 0 from 1952 to 1962
- H1: The average difference in cholesterol is NOT 0 from 1952 to 1962.
First, create the difference, dchol.
data dm; set dixonmassey;
dchol=chol62-chol52;
run;
proc ttest data=dm;
title 'Paired t-test with proc ttest, using dchol variable';
var dchol;
run;
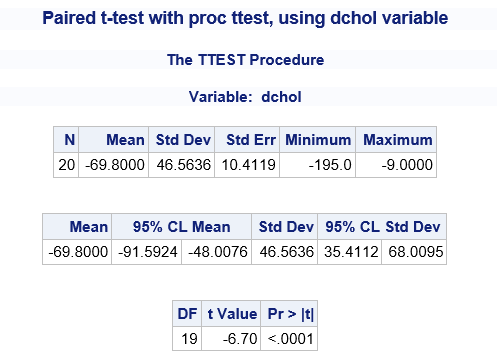
Again, we reject H0 (because p<0.05) and state that we have significant evidence that cholesterol levels changed from 1952 to 1962, with an average decrease of 69.8 units, with 95% confidence limits of (-91.6, -48.0).
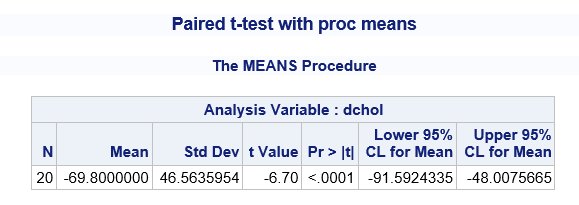
Alternatively, we can (only for a test of H0: μd = 0) use proc means:
proc means data=pairedtest n mean std t prt clm;
title 'Paired t-test with proc means';
var dchol;
run;
Note that the t option produces the t statistic for testing the null hypothesis that the mean of a variable is equal to zero, and the prt option gives the associated p-value. The clm option produces a 95% confidence interval for the mean. In this case, where the variable is a difference, dchol, the null hypothesis is that the mean difference is zero and the 95% confidence interval is for the mean difference.
proc means data=dm n mean std t prt clm;
title 'Paired t-test with proc means';
var dchol;
run;
A third method is to use the original data with the paired option in proc t-test:
proc ttest data=original;
title 'Paired t-test with proc ttest, paired statement';
paired x1*x2;
run;
This produces identical output to the t-test on dchol.
Example:
proc ttest data=work.dm;
title 'Paired t-test with proc ttest, paired statement';
paired chol62*chol52;
run;
Reporting results
We conducted a paired t-test to determine whether, on average, there was a change in cholesterol from 1952 to 1962.
- H0: There is no change, on average, in cholesterol from 1952 to 1962 (H0: μd = 0 where d = chol62 – chol52).
- H1: There is an average change in cholesterol from 1952 to 1962, i.e., H0: μd ≠ 0 .
- Level of significance: α=0.05
- Cholesterol decreased between 1952 and 1962 by an average of 69.8. The 95% confidence interval for μd is (-91.6,-48.0).
- The test statistic is t = -6.70, with 19 degrees of freedom, and p < 0.0001. Because the p-value is less than α=0.05, we reject the null hypothesis and state that there is a difference, on average, in cholesterol between 1952 and 1962.
- Conclusion: There is significant evidence that cholesterol decreased from 1952 to 1962 (p <0.0001). On average, the cholesterol levels in 1962 were 69.8 mg/dl (95% CI: 48.0, 91.6) units lower than the cholesterol levels in 1952.
Note that this report includes:
- The name of the test being used
- A statement of the null hypothesis and alternative hypothesis in terms of the population parameter of interest.
- The magnitude, direction, and units of the effect (observed mean difference).
- a 69.8 unit mean decrease from 1952 to 1962
- Note, this should be reported regardless of whether or not it is statistically significant!
- The test statistic and corresponding degrees of freedom.
- A statement of whether the effect (observed difference) is statistically significant and the significance level (α)
- This decrease was significant at the α = 0.05 level.
- The p-value for the test, p < 0.0001
- Conclusion that summarizes the results and what they mean.