

One-Sample Test of Means
A one sample test of means compares the mean of a sample to a pre-specified value and tests for a deviation from that value. For example we might know that the average birth weight for white babies in the US is 3,410 grams and wish to compare the average birth weight of a sample of black babies to this value.
Assumptions
- Independent observations.
- The population from which the data is sampled is normally distributed.
Hypothesis:

where μ0 is a pre-specified value (in our case this would be 3,410 grams).
Test Statistic
- First calculate
 , the sample mean.
 - We choose an α = 0.05 significance level
- If the standard deviation is known:

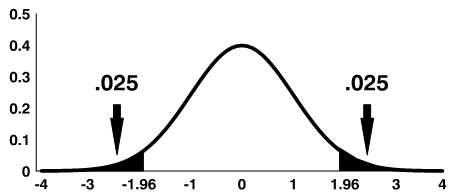
Using the significance level of 0.05, we reject the null hypothesis if z is greater than 1.96 or less than -1.96.
- If the standard deviation is unknown:

Using the significance level of 0.05, we reject the null hypothesis if |t| is greater than the critical value from a t-distribution with df = n-1.
Note: The shaded area is referred to as the critical region or rejection region.
We can also calculate a 95% confidence interval around the mean. The general form for a confidence interval around the mean, if σ is unknown, is
![]()
For a two-sided 95% confidence interval, use the table of the t-distribution (found at the end of the section) to select the appropriate critical value of t for the two-sided α=0.05.
Example: one sample t-test
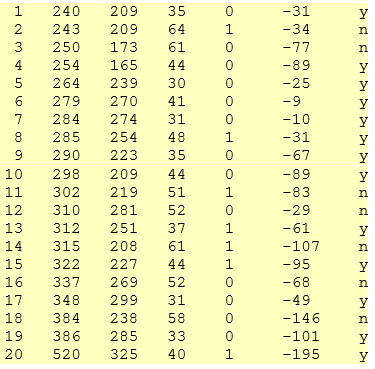
Recall the data used in module 3 in the data file "dixonmassey."
data dixonmassey;
input Obs chol52 chol62 age cor dchol agelt50 $;
datalines;
;
Many doctors recommend having a total cholesterol level below 200 mg/dl. We will test to see if the 1952 population from which the Dixon and Massey sample was gathered is statistically different, on average, from this recommended level.
- H0: μ = 200 vs. H1: μ ≠ 200
- α=0.05
- Our sample of n=20 has = 311.15 and s = 64.3929.
- df = 19, so reject H0 if |t| > 2.093
Calculate:

|t| > 2.093 so we reject H0
The 95% confidence limits around the mean are
311.15 ± (2.093)(64.3929/√20)
311.15 ± 30.14
(281.01, 341.29)
One Sample t-test Using SAS:
proc ttest data=name h0=μ0 alpha=α;
var var;
run;
SAS uses the stated α for the level of confidence (for example, α=0.05 will result in 95% confidence limits). For the hypothesis test, however, it does not compute critical values associated with the given α, and compare the t-statistic to the critical value. Rather, SAS will provide the p-value, the probability that T is more extreme than observed t. The decision rule, "reject if |t| > critical value associated with α" is equivalent to "reject if p < α."
|
SAS will provide the p-value, the probability that T is more extreme than observed t. The decision rule, "reject if |t| > critical value associated with α" is equivalent to "reject if p < α." |

Example:
proc ttest data=dixonmassey h0=200 alpha=0.05;
var chol52;
title 'One Sample t-test with proc ttest';
title2 'Testing if the sample of cholesterol levels in 1952 is statistically different from 200' ;
run;
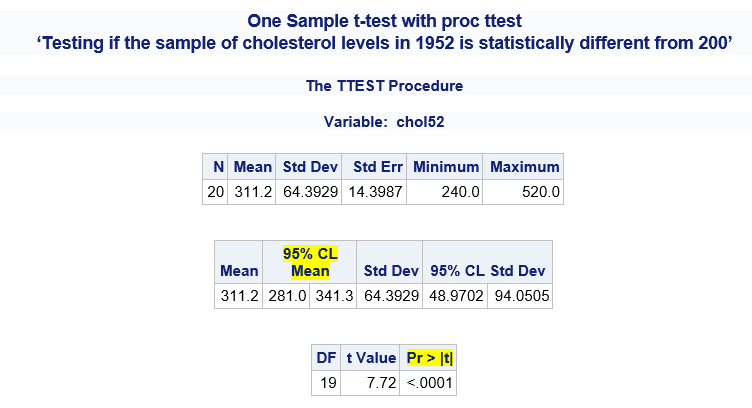
As in our hand calculations, t = 7.72, and we reject H0 (because p<0.0001 which is < 0.05, our selected α level).
The mean cholesterol in 1952 was 311.2, with 95% confidence limits (281.0, 341.3).