


Sample Size for One Sample, Continuous Outcome
In studies where the plan is to perform a test of hypothesis comparing the mean of a continuous outcome variable in a single population to a known mean, the hypotheses of interest are:
H0: μ = μ 0 and H1: μ ≠ μ 0 where μ 0 is the known mean (e.g., a historical control). The formula for determining sample size to ensure that the test has a specified power is given below:

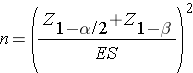
where α is the selected level of significance and Z 1-α /2 is the value from the standard normal distribution holding 1- α/2 below it. For example, if α=0.05, then 1- α/2 = 0.975 and Z=1.960. 1- β is the selected power, and Z 1-β is the value from the standard normal distribution holding 1- β below it. Sample size estimates for hypothesis testing are often based on achieving 80% or 90% power. The Z 1-β values for these popular scenarios are given below:
- For 80% power Z0.80 = 0.84
- For 90% power Z0.90 =1.282
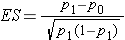
ES is the effect size, defined as follows:
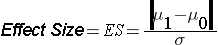
where μ 0 is the mean under H0, μ 1 is the mean under H1 and σ is the standard deviation of the outcome of interest. The numerator of the effect size, the absolute value of the difference in means | μ 1 - μ 0 |, represents what is considered a clinically meaningful or practically important difference in means. Similar to the issue we faced when planning studies to estimate confidence intervals, it can sometimes be difficult to estimate the standard deviation. In sample size computations, investigators often use a value for the standard deviation from a previous study or a study performed in a different but comparable population. Regardless of how the estimate of the variability of the outcome is derived, it should always be conservative (i.e., as large as is reasonable), so that the resultant sample size will not be too small.
Example 7:
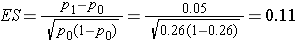
An investigator hypothesizes that in people free of diabetes, fasting blood glucose, a risk factor for coronary heart disease, is higher in those who drink at least 2 cups of coffee per day. A cross-sectional study is planned to assess the mean fasting blood glucose levels in people who drink at least two cups of coffee per day. The mean fasting blood glucose level in people free of diabetes is reported as 95.0 mg/dL with a standard deviation of 9.8 mg/dL.7 If the mean blood glucose level in people who drink at least 2 cups of coffee per day is 100 mg/dL, this would be important clinically. How many patients should be enrolled in the study to ensure that the power of the test is 80% to detect this difference? A two sided test will be used with a 5% level of significance.
The effect size is computed as:
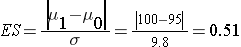 .
.
The effect size represents the meaningful difference in the population mean - here 95 versus 100, or 0.51 standard deviation units different. We now substitute the effect size and the appropriate Z values for the selected α and power to compute the sample size.
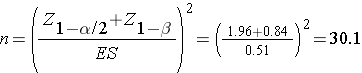
Therefore, a sample of size n=31 will ensure that a two-sided test with α =0.05 has 80% power to detect a 5 mg/dL difference in mean fasting blood glucose levels.
In the planned study, participants will be asked to fast overnight and to provide a blood sample for analysis of glucose levels. Based on prior experience, the investigators hypothesize that 10% of the participants will fail to fast or will refuse to follow the study protocol. Therefore, a total of 35 participants will be enrolled in the study to ensure that 31 are available for analysis (see below).
N (number to enroll) * (% following protocol) = desired sample size
Therefore N (number to enroll) = desired sample size/(% retained)
N = 31/0.90 = 35.
Sample Size for One Sample, Dichotomous Outcome
In studies where the plan is to perform a test of hypothesis comparing the proportion of successes in a dichotomous outcome variable in a single population to a known proportion, the hypotheses of interest are:

versus

where p0 is the known proportion (e.g., a historical control). The formula for determining the sample size to ensure that the test has a specified power is given below:
where α is the selected level of significance and Z 1-α /2 is the value from the standard normal distribution holding 1- α/2 below it. 1- β is the selected power and Z 1-β is the value from the standard normal distribution holding 1- β below it , and ES is the effect size, defined as follows:
where p0 is the proportion under H0 and p1 is the proportion under H1. The numerator of the effect size, the absolute value of the difference in proportions |p1-p0|, again represents what is considered a clinically meaningful or practically important difference in proportions.
Example 8:
A recent report from the Framingham Heart Study indicated that 26% of people free of cardiovascular disease had elevated LDL cholesterol levels, defined as LDL > 159 mg/dL.9 An investigator hypothesizes that a higher proportion of patients with a history of cardiovascular disease will have elevated LDL cholesterol. How many patients should be studied to ensure that the power of the test is 90% to detect a 5% difference in the proportion with elevated LDL cholesterol? A two sided test will be used with a 5% level of significance.
We first compute the effect size:
We now substitute the effect size and the appropriate Z values for the selected α and power to compute the sample size.
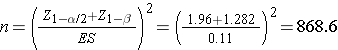
A sample of size n=869 will ensure that a two-sided test with α =0.05 has 90% power to detect a 5% difference in the proportion of patients with a history of cardiovascular disease who have an elevated LDL cholesterol level.

A medical device manufacturer produces implantable stents. During the manufacturing process, approximately 10% of the stents are deemed to be defective. The manufacturer wants to test whether the proportion of defective stents is more than 10%. If the process produces more than 15% defective stents, then corrective action must be taken. Therefore, the manufacturer wants the test to have 90% power to detect a difference in proportions of this magnitude. How many stents must be evaluated? For you computations, use a two-sided test with a 5% level of significance. (Do the computation yourself, before looking at the answer.)