
Study Design
Exposure assessments can be applied in many different contexts meaning the objectives can be very different from one study to the next. In occupational and environmental epidemiology, investigators are often attempting to examine the relationship between an exposure and a health outcome of interest. Examples of common study designs used in occupational and environmental epidemiology include case-control, cohort, cross-sectional, and time series.
For more information on epidemiological study designs, review the following modules:
When designing a study to estimate exposure, it is important to take into consideration the following questions:
- What is the exposure being measured and how does it relate to the proposed causal agent?
- What methods will be used to determine exposure (i.e. what does it mean to be "exposed"?)?
- How many samples (i.e. sample size) should be taken to be able to detect an association?
- Who is the exposed population and how might vulnerable sub-population be affected differently?
- When and for how long (duration and frequency) will exposure data be captured?
What? - Causal Agent or Surrogate
It is important to distinguish between what the actual agent of concern is and what is being measured in the study. At times it may be difficult or impossible to measure exposure to the actual agent. In such cases, exposure to a surrogate is estimated. The surrogate being used to measure exposure should closely correlate with the actual causal agent. Another important consideration when using surrogates is identifying where they belong on the exposure-response pathway.
While investigators can measure exposure at the source or in the media, such measurements may not accurately reflect actual exposure due to factors such as the environmental fate and transport of a given agent. Biomarkers are an example of a surrogate that is more indicative of the absorbed dose of a given agent as opposed to the actual exposure for an individual or population. Factors such as absorption, distribution, metabolism, and excretion will affect how much of the exposed agent is bioavailable.
Assessing exposure can take place at any point along the exposure-related disease pathway. Review the examples of exposure measurements listed below and determine where they belong in the exposure-related disease pathway, which includes sources/emissions, environmental media, micro-environment, routes of exposure, absorbed dose, biologically effect dose, and altered structure/function.
- Blood cholinesterase to assess exposure to organophosphates
- Soil arsenic levels in playgrounds to assess children's exposure
- PAH-DNA adducts to assess PAH exposure
- Skin wipes to measure dermal exposure to pthalates
- Blood lead levels to assess lead exposure
- Industry reporting on lead emissions to measure lead exposure
- Ambient air samples at fixed locations to collect particulate matter data
How? - Data Collection
Exposure assessments are often tasked with trying to obtain accurate, precise, and biologically relevant exposure estimates in the most efficient and cost-effective way. The data collection methods employed by an exposure assessment often require a balancing act between accuracy/precision of data and logistic constraints, such as time, money, and resources. If too much of the accuracy and precision are compromised during this balancing act, errors such as misclassification of exposure can be introduced into the study resulting in attenuated estimates and even loss of power. Such error will be discussed later in the module.
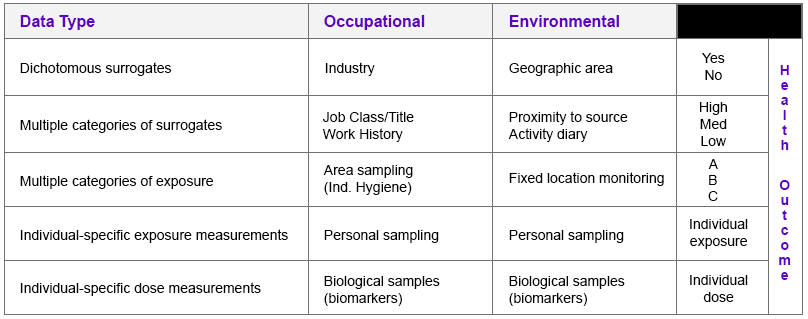
Exposure can be classified, measured, or modelled with what are often referred to as direct or indirect methods.
Classification: Subjects in an exposure assessment can be classified using dichotomous values such as "exposed" or "not exposed" to a particular substance. Classifications can also incorporate multiple categories of exposure, such as "no", "low", "medium", and "high" or different job titles for an occupational study. Such classifications can be obtained through questionnaires or by expert assessment.
Measurement: As a direct method, measurements are often considered a more objective means of assessing exposure. The most common measurement utilized is the concentration of a given agent. Area monitors are used to estimate exposure to individuals living within a certain proximity and personal monitors can be used to measure individual-specific exposure.
Modelling: Modelling of exposure is often carried out in conjunction with measurements and can be helpful when there is a lack of monitoring data. Exposure assessment models are often based on assumptions about actual exposure and more sophisticated models will takes into consideration factors that may influence exposure (e.g. physical and chemical properties, and fate and transport of an agent). Sources such as the EPA provide a variety of models that can be utilized by researchers to predict exposure.
Shown below is a diagram that provides some examples of collecting exposure data and the different methods that can be employed.
How Much? - Sample Size
The number of samples collected, the number of subjects in the study, and the number of locations from which samples are collected are all important considerations that directly affect the statistical power of any study performed. Determining sample size is often an issue of trying to overcome random error. Sample size calculations are often performed to determine how many samples or subjects are required to detect a statistically significant difference between the population mean hypothesized under the null and alternative hypotheses. To learn more, you may review the modules on sample size and power and random error.
Environmental exposures present some unique challenges investigators must consider with respect to sample size. Both sample size and magnitude of effect can influence statistical power. Environmental exposures are common and relatively low making it difficult to find unexposed groups and the magnitude of effect small. In order to offset these factors that can diminish the statistical power of a study, larger sample sizes are required.
Type I & II Errors
Hypothesis testing can lead to type I & II errors which is illustrated in the diagram below and described further. Small sample size is a common reason for type II errors.
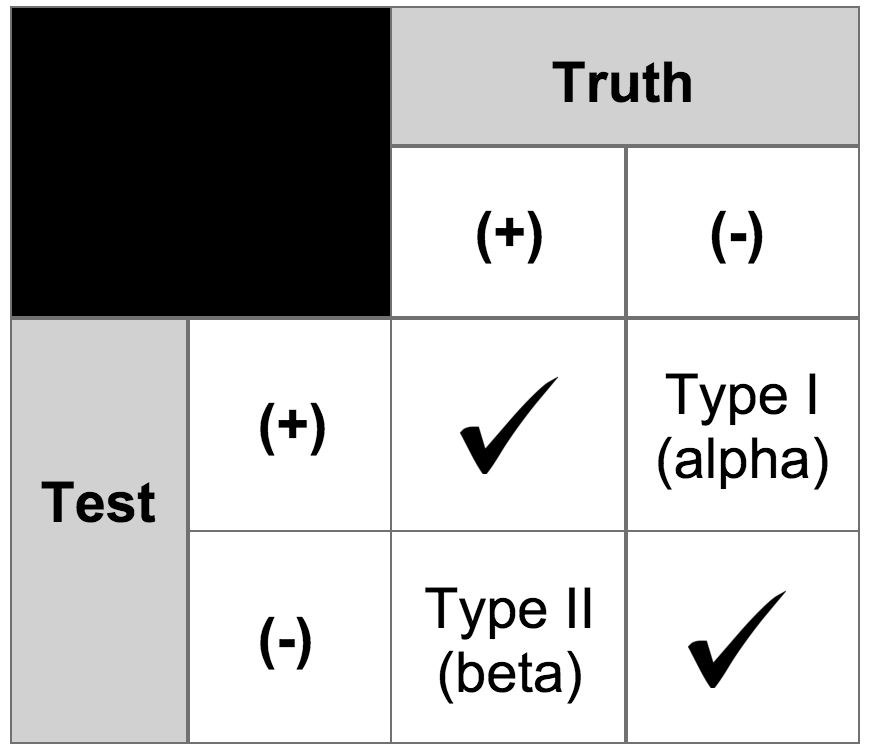
- Type I Error:
Reject the null hypothesis when it is true - Type II Error:
Fail to reject the null hypothesis when it is not true (i.e. believe the null hypothesis to be true when it is not)
Type I & II Error Explained with a Fable

The boy who cried wolf is a well known fable that can help explain type I and type II errors.
- The first mistake, or Type I error, is when the boy cried wolf and the villagers believed him and came to help. But there was, in fact, no wolf. This would be a false positive.
- The second mistake, or Type II error, is when the boy cried wolf when there actually was a wolf, but the villagers did not believe him, and therefore did not help him. This would be a false negative.
Who or Where? - Exposed Population
When conducting an exposure assessment and designing a study, the consequences of having a poorly defined population can be costly and undermine the validity of the study. In evaluating the effect of an agent, investigators must consider the media that are contaminated and whether people in the community are exposed to that media, meaning they are drinking that water, breathing that air, eating those biota, or having skin contact with those soils or other media. Also, consider the presence and location of microenvironments, such as schools, nursing homes, hospitals, daycare centers, etc.
It is important to consider special populations that may have increased susceptibility to adverse effects upon exposure to a given agent. Examples of special populations that may be particularly vulnerable or sensitive to the effects of certain agents include children, people with chronic illnesses, pregnant women and their fetuses, nursing women, and the elderly.
When? - Exposure Dimensions
There are three dimensions to exposure: duration, concentration, and frequency. Given the dimensions of duration and frequency, it becomes clear that time plays a key role in estimating exposure. One must consider a relevant time period in relation to the outcome. Depending on how long exposure has occurred, the health outcomes may vary. Long-term, chronic exposure to a given agent will often result in different outcomes compared to short-term, chronic exposures.
The duration of exposure may also affect which study design is chosen. In the case of long-term exposures, a retrospective cohort (in which exposure has already occurred) or cross-sectional study might be more feasible. Longitudinal studies in which subjects are followed for a period of time until the development of a given outcome tend to yield more internal validity, but also prove to be more costly and require a greater amount of resources.
In the event that exposure is being monitored, investigators must determine a sample duration time to collect exposure information. For example, investigators in an occupational exposure assessment may use a work shift as the sampling duration.
Measurement Error
All exposure assessments require some way of measuring exposure to a given agent, which can result in measurement error (i.e. exposure measurements determined from samples are not representative of actual exposure). Measurement error is the difference between the true exposure and a measured or observed exposure. While large inter-individual or inter-group differences can be important to detect statistically significant differences, investigators do not want such large inter-individual differences among individuals with similar exposures (i.e. between-subject variability).
Common sources of measurement error include the following:
- Faulty equipment or instruments used to estimate exposure
- Deviations from data collection protocols
- Limitations due to study participant characteristics
- Data entry and/or analysis errors
The table below uses a regression equation to demonstrate the impact measurement error can have on risk estimates in a given study. The first equation highlights what investigators want which is being able to determine the health outcome ("y") based on true exposure ("x"). However, investigators determine health outcome as a function of a measured/observed exposure ("z"). The key concern is the difference between βx and βz.
Impact on Risk Estimates
- What investigators want:
- y = α + βxx + ε
- What investigators have:
- yij= α + βzzij + εij
- α and β are coefficients to be estimated and ε is residual error.
- x = true exposure
- y = health outcome
- z = measured/observed exposure
- i = individual 'i'
- j = day 'j'
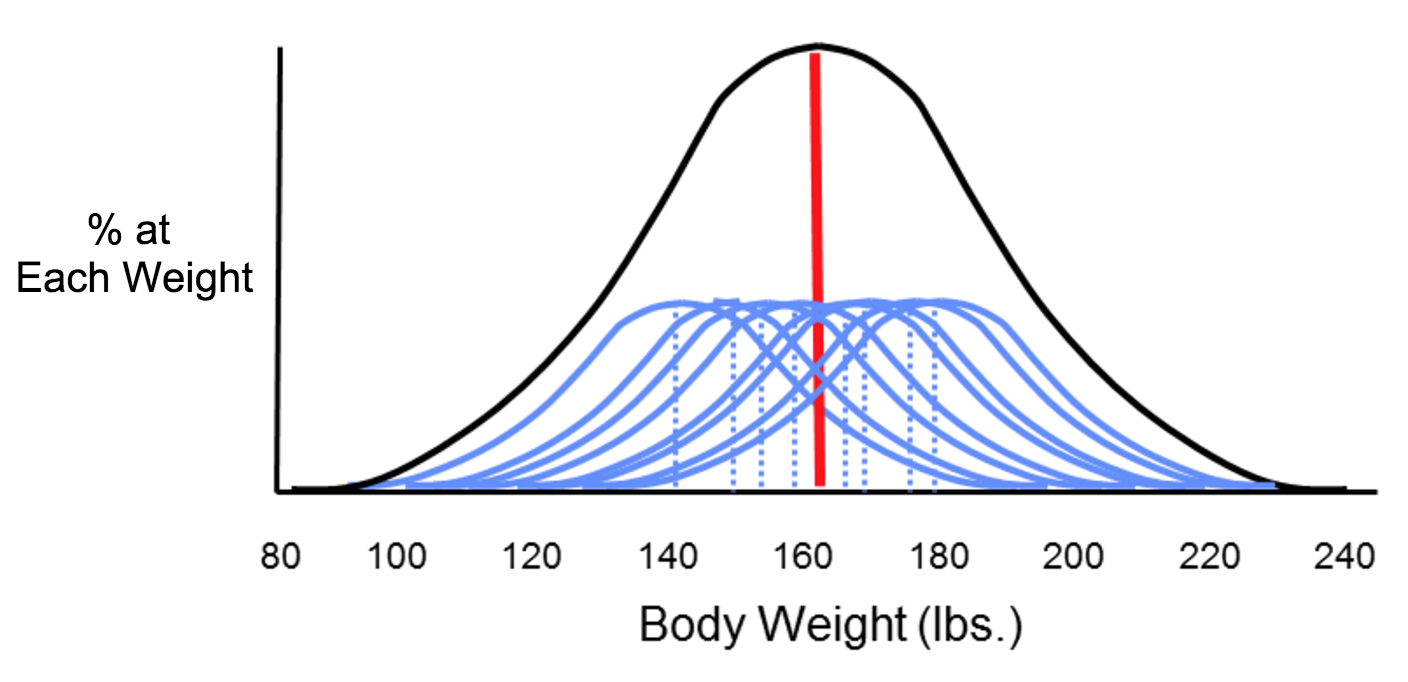
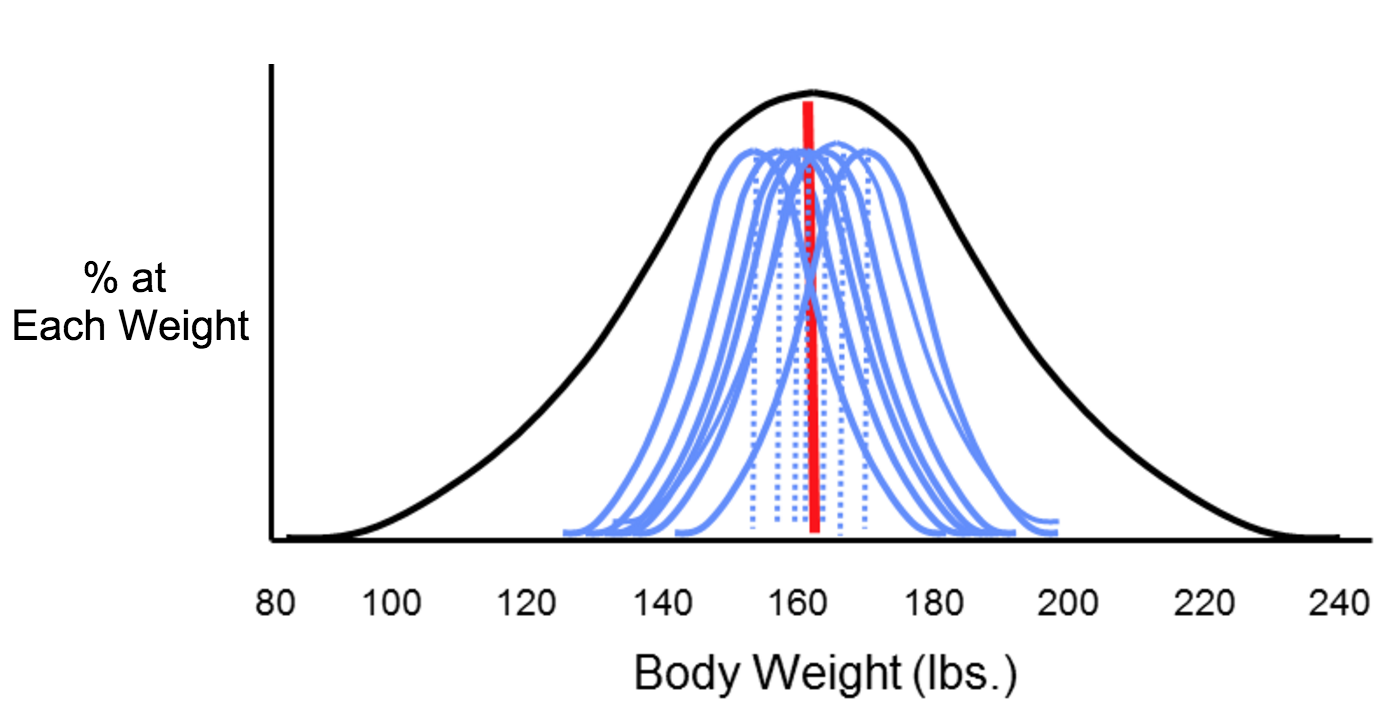
The two types of error that can result from measurements are systematic and random error, which can affect the accuracy and precision of exposure measurements. Suppose investigators wanted to monitor changes in body weight over time among the students at Boston University. In theory, they could weigh all of the students with an accurate scale, and would likely find that body weight measurements were more or less symmetrically distributed along a bell-shaped curve. Knowing all of their weights, investigators could also compute the true mean of this student population. However, it really isn't feasible to collect weight measurements for every student at BU. If investigators just want to follow trends, an alternative is to estimate the mean weight of the population by taking a sample of students each year. In order to collect these measurements, investigators use two bathroom scales. It turns out that one of them has been calibrated and is very accurate, but the other has not been calibrated, and it consistently overestimates body weight by about ten pounds.
Now consider four possible scenarios as investigators try to estimate the mean body weight by taking samples. In each of the four panels (shown below), the distribution of the total population (if investigators measured it) is shown by the black bell-shaped curve, and the vertical red line indicates the true mean of the population. Review the illustration below for more information.
Small Sample Size (n = 5 students)
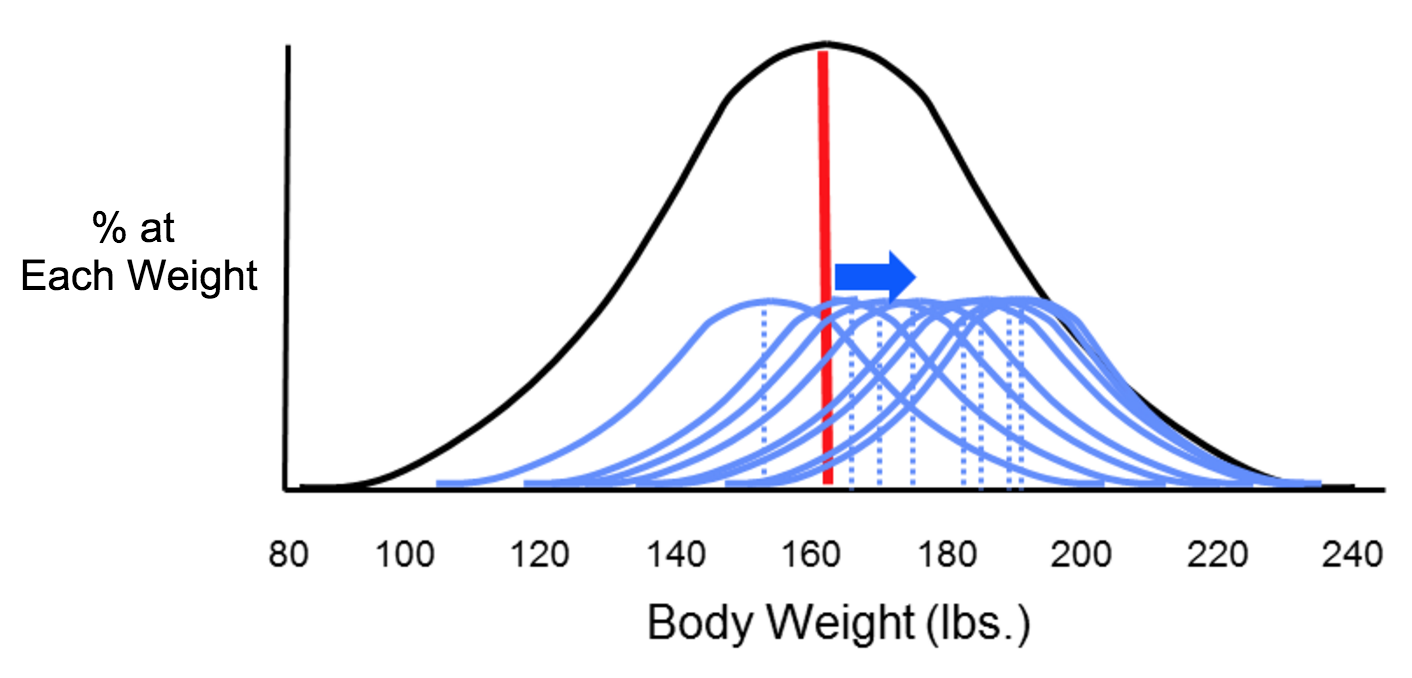
Larger Sample Size (n = 50 students)

Misclassification of Exposure
For environmental exposures, exposure data is often collected on an aggregate scale since individual exposure measurements can be difficult or impossible to collect, which can lead to random misclassification of exposure. Another source of random misclassification takes place as a result of the intra-individual (within-subject) variability, particularly when investigating chronic effects. For example, a study looking to assess dietary pesticide exposure may need to address how dietary intake for an individual may change seasonally, which would result in different exposure levels for the same individual.
Non-random, or differential misclassification of exposure takes place when errors in exposure are more likely to occur in one of the groups being compared. Random misclassification of exposure is when errors in exposure are equally likely to occur in all exposure groups. Random misclassification can be broken down into two categories: Berkson error model and classical error. Berkson error model refers to random misclassification that results in little to no bias in the measurement whereas classical error refers to random misclassification that tends to attenuate the risk estimates (i.e. bias towards the null).
An epidemiological study looking to examine the association between environmental tobacco smoke (ETS) and asthma exacerbation in children may define their exposed population as children living with one or more parents who smoke. What are some of the limitations regarding this classification of the exposed population?
Minimizing Exposure Error
There are measures that can be taken throughout a study (design, data collection, and analysis phase) to minimize or adjust for measurement error. For example, validation studies are studies that attempt to assess a given method of collecting exposure compared to a "gold standard." For example, a study might collect a single urine sample from study participants to analyze it for organophosphate metabolites. But the "gold standard" is to collect 24-hour urine samples. A validation study attempts to determine the level of agreement between the single urine sample and 24-hour urine samples.