
Dietary Monitoring
Ingestion is a common route of exposure for many different agents with the food we eat being a major source of exposure to many agents. Dietary exposure assessments help estimate exposure to both accidental and intentional substances and how that may affect one's health. This can include assessing the overall quantity and nutrition of food, the chemicals present in certain types of food, whether they are intentional chemicals such as those common in processed foods, or accidental chemicals as is the case in adulterated food (e.g. fruit containing pesticides or antibiotics).
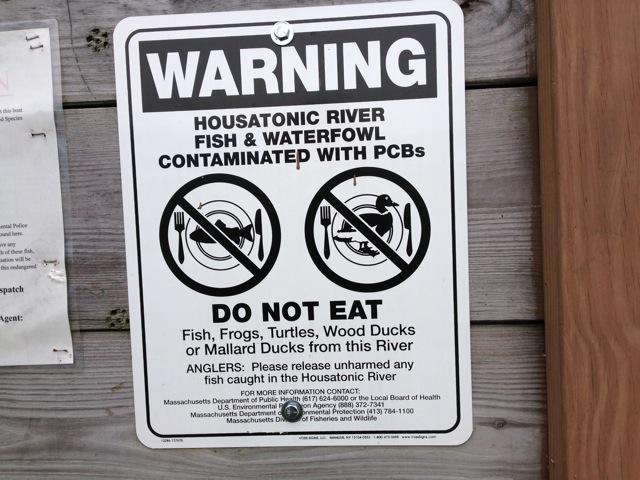
Shown below is a sign on the Housatonic River warning people not to eat animals from the river due to PCB contamination. General Electric will cover costs of an EPA-led cleanup of the river since the company had a factory on the river in Pittsfield, MA that released PCBs, which have recently been upgraded in the IARC Monographs to Group 1, known carcinogens.
Since dietary exposure assessments can focus on many different agents and a variety of exposure scenarios, this module will focus on dietary exposure to pesticides and some of the methods employed to estimate exposure to dietary pesticide intake.
The Environmental Working Group (EWG) is a non-profit organization that conducts research to assess the potential health impact from exposure to toxic chemicals via a myriad of sources with food being one. They release a report annually providing consumers a guide to pesticides in a variety of food sources. As part of their consumer guide, the EWG has identified the "dirty dozen" and the "clean fifteen" to identify which food products are among the most and the least contaminated with pesticides. Review the EWG Dirty Dozen list prior to answering the following question.
Estimating Dietary Exposure
The Food Quality Protection Act (FQPA) was passed by Congress in 1996 and completely revised the nation's pesticide regulation since the 1960s. It mandates a health-based standard for pesticides used in foods, provides special protections to vulnerable populations (pregnant women, infants and children), and created a more streamlined process for approving of and incentivizing the use of safe pesticides.
A general algorithm for estimating dietary ingestion exposure of pesticides as well as the risk was established. The algorithm takes into account the frequency of pesticide residue detection and the levels, the number of pesticides detected in the single commodity, and the toxicity of the pesticides as shown in the formulas below.
Estimating Dietary Exposure and Risk to Pesticides
- To estimate dietary exposure, there are two components to consider in the formula: (1) average pesticide residue found on a given food product and (2) how much of a given food product is consumed on average. Both are discussed in greater detail in the next section.
- Once exposure has been estimated, risk can be determined by multiplying the exposure level by the hazard.
In order to determine dietary exposure to pesticides, one needs to determine how much pesticide residue is on a given food product and how much of that food product is consumed on average. These are two dependent variables where consumption determines exposure and residue magnifies/modifies the risk. Quantifying both residue and consumption are equally important and critical to estimating dietary exposure. The following table highlights both dietary consumption and pesticide residue databases.
Dietary Consumption Databases
- National Health and Nutrition Examination Survey (NHANES)
- Nurses' Health Study (NHS)
- National Children Study (NCS)
Pesticide Residue Databases
Dietary consumption surveys such as NHANES can be a powerful tool for researchers since it is such a large database and includes many tutorials on how the database can be used. However, such cross-sectional surveys are limited in that they do not account for seasonal differences in food consumption. Thinking back to the "dirty dozen," this can be problematic since many of the seasonal foods/commodities can have incur higher risk for pesticide exposure. Furthermore, cross-sectional survey data is unable to reveal some of the unique consumption patterns within a region or subset of a population.
Collecting Dietary Data - Longitudinal
Longitudinal dietary data can be collected via person-to-person interviews similar to cross-sectional surveys. However, the use of person-to-person interviews can be very expensive and require the use of more time and resources. The table below highlights additional methods that can be employed to collected dietary day.
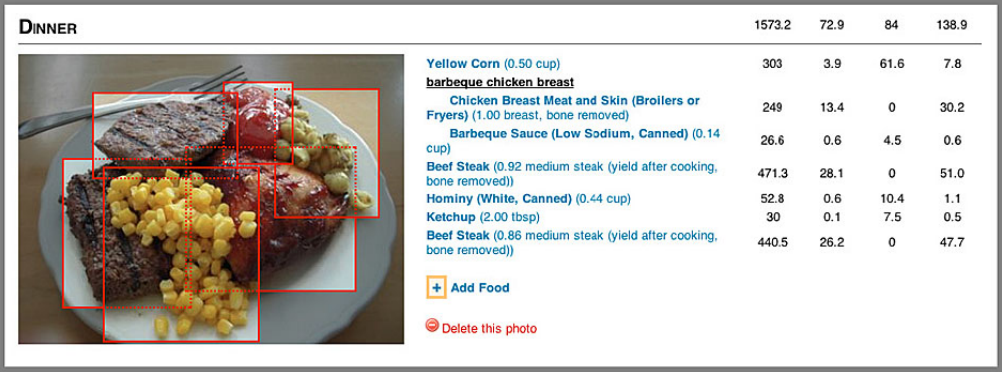
Digital Photos
With the use of digital photography, images of the food selection and then the leftovers are captured and analyzed using computer software to quantify how much food was consumed. This method started with researchers capturing food intake data in cafeterias and relied on trained individuals to capture the images as well as compare them to standard portions. The Remote Food Photography Methods was derived from this method to further expand on data collection beyond cafeterias and enable participants to take pictures of their food selections using smartphones and send to researchers via wireless data transfer.
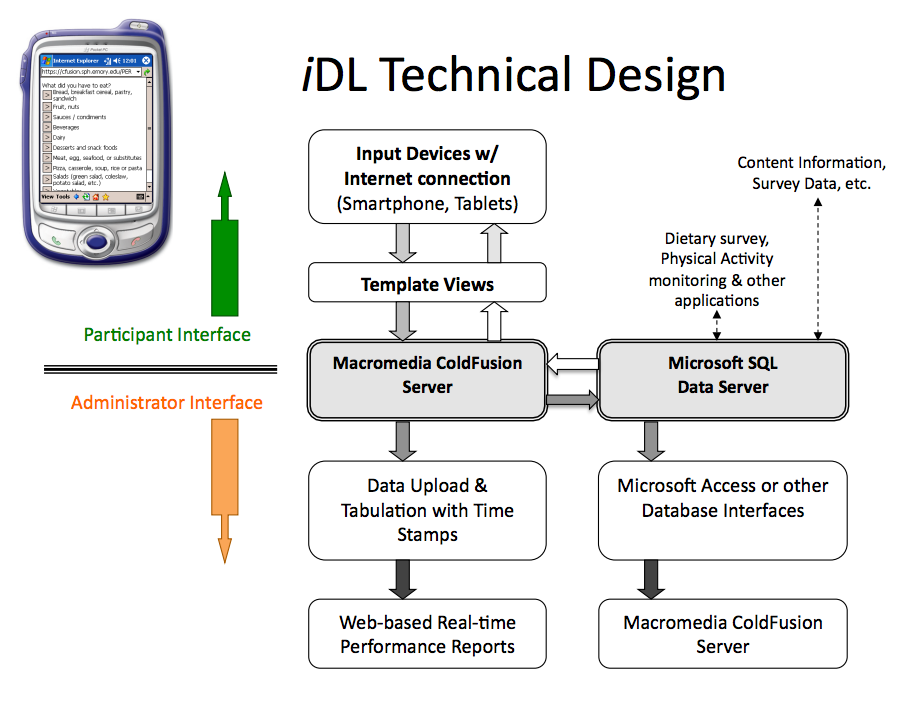
Internet Data Logger (iDL)
The iDL is a real-time web-based system designed for optimal performance with mobile devices. It is comparable to an in-person interview without the inconvenience and constraints of in-person interviews. The survey data is received and compiled instantaneously. iDLs have the benefit of improving participant adherence to protocols and can be adaptive to other surveys if researchers wish to collect additional data, such as behavior, activity, medical records, etc.
This page focuses on dietary exposure to pesticides and formulas that pertain to pesticide residues. However, diet or food is not the only means of ingestion exposure. What are some ways individuals may be exposed to pesticides through ingestion that do not involve one's diet?
Multiple Residues Data
Food that is contaminated by pesticide exposure is often contaminated with more than one type of pesticide. When determining dietary exposure to multiple pesticide residues, it is not correct to simply arithmetically add residues of different pesticides that have different toxicities. The relative potency factor (RPF) is a normalizing factor for the potency or toxicity among different pesticides in relation to the index pesticide. The amount of residue of each pesticide should be adjusted by multiplying by an RPF in order to obtain the equivalent residue of the index pesticide.
The table below shows the algorithm for estimating exposure to multiple residues (Exposureindex).
RPF-Based Multi-residue Algorithm
- Step 1. First calculate the index residue of each pesticide of interest by multiplying its residue by its residue potency factor.
- Step 2. Then calculate the index exposure for each pesticide of interest by multiplying the product of Step 1 with the average consumption of the food product of interest.
- Step 3. To estimate cumulative exposure to all of the pesticides, find the sum of all the index exposures calculated in Step 2.
Practical Application
Assessing Children’s Dietary Pesticide Exposure: Direct Measurement of Pesticide Residues in 24-Hr Duplicate Food Samples is an article by Lu et al. Researchers investigated children's dietary exposure to pesticides using a more direct measurement known as the 24-hr duplicate food samples in order to compare pesticide residues from direct measurements to those reported by the USDA Pesticide Data Program. Review the introduction and study methods prior to answering the questions below.