

Summary
Time to event data, or survival data, are frequently measured in studies of important medical and public health issues. Because of the unique features of survival data, most specifically the presence of censoring, special statistical procedures are necessary to analyze these data. In survival analysis applications, it is often of interest to estimate the survival function, or survival probabilities over time. There are several techniques available; we present here two popular nonparametric techniques called the life table or actuarial table approach and the Kaplan-Meier approach to constructing cohort life tables or follow-up life tables. Both approaches generate estimates of the survival function which can be used to estimate the probability that a participant survives to a specific time (e.g., 5 or 10 years).
The notation and template for each approach are summarized below.
Actuarial, Follow-Up Life Table Approach
|
Time Intervals |
Number At Risk During Interval, Nt |
Average Number At Risk During Interval, Nt* = Nt-Ct/2 |
Number of Deaths During Interval, Dt |
Lost to Follow-Up, Ct |
Proportion Dying qt = Dt/Nt* |
Proportion Surviving pt = 1-qt
|
Survival Probability St = pt*St-1 (S0=1) |
|
|
|
|
|
|
|
|
|
Kaplan-Meier Approach
|
Time |
Number at Risk Nt |
Number of Deaths Dt |
Number Censored Ct |
Survival Probability St+1 = St*((Nt+1-Dt+1)/Nt+1) (S0=1) |
|
|
|
|
|
|
It is often of interest to assess whether there are statistically significant differences in survival between groups between competing treatment groups in a clinical trial or between men and women, or patients with and without a specific risk factor in an observational study. There are many statistical tests available; we present the log rank test, which is a popular non-parametric test. It makes no assumptions about the survival distributions and can be conducted relatively easily using life tables based on the Kaplan-Meier approach.
There are several variations of the log rank statistic as well as other tests to compare survival curves between independent groups.
We use the following test statistic which is distributed as a chi-square statistic with degrees of freedom k-1, where k represents the number of independent comparison groups:

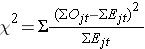
where ΣOjt represents the sum of the observed number of events in the jth group over time and ΣEjt represents the sum of the expected number of events in the jth group over time. The observed and expected numbers of events are computed for each event time and summed for each comparison group over time. To compute the log rank test statistic, we compute for each event time t, the number at risk in each group, Njt (e.g., where j indicates the group) and the observed number of events Ojt in each group. We then sum the number at risk, Nt , in each group over time to produce ΣNjt , the number of observed events Ot , in each group over time to produce ΣOjt , and compute the expected number of events in each group using Ejt = Njt*(Ot/Nt) at each time. The expected numbers of events are then summed over time to produce ΣEjt for each group.
Finally, there are many applications in which it is of interest to estimate the effect of several risk factors, considered simultaneously, on survival. Cox proportional hazards regression analysis is a popular multivariable technique for this purpose. The Cox proportional hazards regression model is as follows:

where h(t) is the expected hazard at time t, h0(t) is the baseline hazard and represents the hazard when all of the predictors X1, X2 ... , Xp are equal to zero.
The associations between risk factors and survival time in a Cox proportional hazards model are often summarized by hazard ratios. The hazard ratio for a dichotomous risk factor (e.g., treatment assignment in a clinical trial or prevalent diabetes in an observational study) represents the increase or decrease in the hazard in one group as compared to the other.
For example, in a clinical trial with survival time as the outcome, if the hazard ratio is 0.5 comparing participants on a treatment to those on placebo, this suggests a 50% reduction in the hazard (risk of failure assuming the person survived to a certain point) in the treatment group as compared to the placebo. In an observational study with survival time as the outcome, if the hazard ratio is 1.25 comparing participants with prevalent diabetes to those free of diabetes then the risk of failure is 25% higher in participants with diabetes.