


Confidence Interval for One Sample, Dichotomous Outcome
Suppose we wish to estimate the proportion of people with diabetes in a population or the proportion of people with hypertension or obesity. These diagnoses are defined by specific levels of laboratory tests and measurements of blood pressure and body mass index, respectively. Subjects are defined as having these diagnoses or not, based on the definitions. When the outcome of interest is dichotomous like this, the record for each member of the sample indicates having the condition or characteristic of interest or not. Recall that for dichotomous outcomes the investigator defines one of the outcomes a "success" and the other a failure. The sample size is denoted by n, and we let x denote the number of "successes" in the sample.
For example, if we wish to estimate the proportion of people with diabetes in a population, we consider a diagnosis of diabetes as a "success" (i.e., and individual who has the outcome of interest), and we consider lack of diagnosis of diabetes as a "failure." In this example, X represents the number of people with a diagnosis of diabetes in the sample. The sample proportion is p̂ (called "p-hat"), and it is computed by taking the ratio of the number of successes in the sample to the sample size, that is:
p̂= x/n
Confidence Interval for the Population Proportion
If there are more than 5 successes and more than 5 failures, then the confidence interval can be computed with this formula:

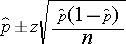
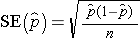
The point estimate for the population proportion is the sample proportion, and the margin of error is the product of the Z value for the desired confidence level (e.g., Z=1.96 for 95% confidence) and the standard error of the point estimate. In other words, the standard error of the point estimate is:
This formula is appropriate for large samples, defined as at least 5 successes and at least 5 failures in the sample. This was a condition for the Central Limit Theorem for binomial outcomes. If there are fewer than 5 successes or failures then alternative procedures, called exact methods, must be used to estimate the population proportion.1,2
Example: During the 7th examination of the Offspring cohort in the Framingham Heart Study there were 1219 participants being treated for hypertension and 2,313 who were not on treatment. If we call treatment a "success", then x=1219 and n=3532. The sample proportion is:
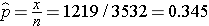
This is the point estimate, i.e., our best estimate of the proportion of the population on treatment for hypertension is 34.5%. The sample is large, so the confidence interval can be computed using the formula:
Substituting our values we get
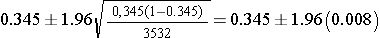
which is
So, the 95% confidence interval is (0.329, 0.361).
Thus we are 95% confident that the true proportion of persons on antihypertensive medication is between 32.9% and 36.1%.
Specific applications of estimation for a single population with a dichotomous outcome involve estimating prevalence, cumulative incidence, and incidence rates.

The table below, from the 5th examination of the Framingham Offspring cohort, shows the number of men and women found with or without cardiovascular disease (CVD). Estimate the prevalence of CVD in men using a 95% confidence interval.
|
|
Free of CVD |
Prevalent CVD |
Total |
|
Men |
1,548 |
244 |
1,792 |
|
Women |
1,872 |
135 |
2,007 |
|
Total |
3,420 |
379 |
3,799 |