


Ratios, Proportion, and Rates
Ratios are simply expressions of one measure relative to another. There are several types of ratios that are frequently used in public health.
Simple Ratios
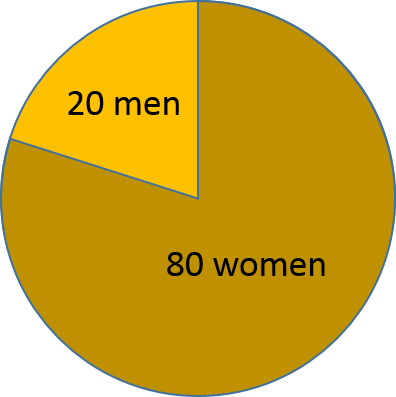
Consider a class that has 20 male students and 80 female students. We can think about this in several ways. We could express this simply as the ratio of men to women and write the relationship as 20:80 or 20/80. We can also simplify this by dividing both the numerator and the denominator by a number that divides evenly into both the numerator and the denominator. In this case, we could divide both by 20 to simplify this to a 1:4 ratio (or 1/4 ratio). This indicates that for every man, there are four women.
We could also consider this from the inverse perspective, i.e., the number of women relative to the number of men; in this case the ratio of women to men is 80/20 which is equivalent to 4 to 1, i.e., there are four women for every man.
Proportions
A proportion is a type of ratio that relates a part to a whole. For example, in the class with with 20 men and 80 women, the total class size is 100, and the proportion of men is 20/100 or 20%. The proportion of women is 80/100 or 80%. In both of these proportions the size of part of the class is being related to the size of the entire class. The class above conveniently had a total size of 100, but this usually isn't the case.
If we go back to the information on mortality from bird flu that was presented on the previous page, it can be seen that there are several ways of thinking about this basic information.
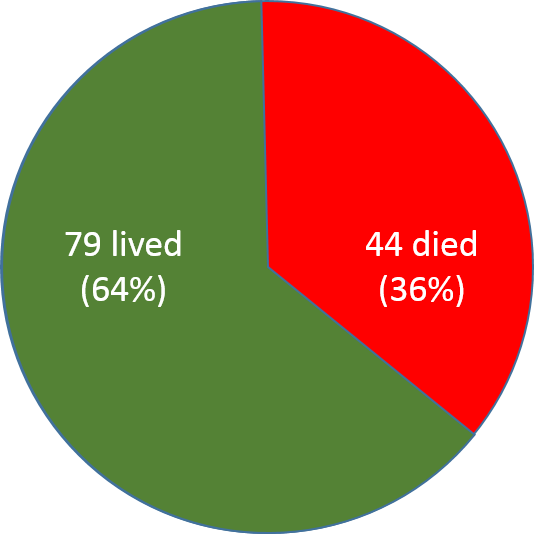
The fact that 44 died and the other 79 lived could be expressed as a simple ratio, which compares the number who died to the number who survived. 44/79 or 44:79 would be two ways of expressing this simple ratio. The ratio of those who died relative to those who lived was 44 to 79.
Alternatively, we might want to focus on the proportion who lived. In total, 123 people were infected, and 44 of these died. Therefore, the proportion who died was 44/123, which could be expressed as a decimal fraction (0.36) or as a percentage (36%). This proportion is referred to as the "case-fatality" rate, although strictly speaking, it is a proportion and not a rate.

Rates
|
|
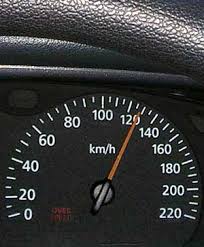
Rates are a special type of ratio that incorporate the dimension of time into the denominator. Familiar examples include measurements of speed (miles per hour) or water flow (gallons per minute). Example #1: If a car travels 24 miles in 2 hours, its average speed is a rate of 24 miles/ 2 hours = 12 miles/hr. Example #2: Suppose a car traveled 24 miles in 2 hours, then continued and traveled miles in 3 hours, and then another 12 miles in 1 hour. We can compute the average rate of speed for the entire trip by adding up the total distance covered and dividing it by the total time that the trip took. Average speed for the trip = (24 miles + 24 miles + 12 miles) / (2 hour + 3 hours +1 hour) = 60 miles / 6 hours = 10 miles per hour |
Note that some commonly used measurements of health outcomes are referred to as "rates" even though they are actually proportions.
For example:
- A mortality rate is the proportion of deaths occurring over a span of time in a population.
- An attack rate is the proportion of people developing an infectious disease after exposure to a pathogen.
- A case-fatality rate is the proportion of individuals who die after developing a disease.
Strictly speaking, these are all proportions, but incidence rates or incidence density is a measurement of the frequency of a health outcome that is more like a true rate. An incidence rate basically quantifies the number of health outcomes and the total exposure time (i.e., time at risk) in a group or population. Similar to computation of an average speed for an automobile, an incidence rate is computed by dividing the total number of health-related events that occurred by the total exposure time at risk for the group.
For example, consider a hypothetical clinical trial that was conducted to determine whether taking low-dose aspirin reduced the frequency of heart attacks in middle-aged and elderly men. The time line below summarizes events 12 subjects labeled 1-12, all of whom were allocated to the placebo-treated group.
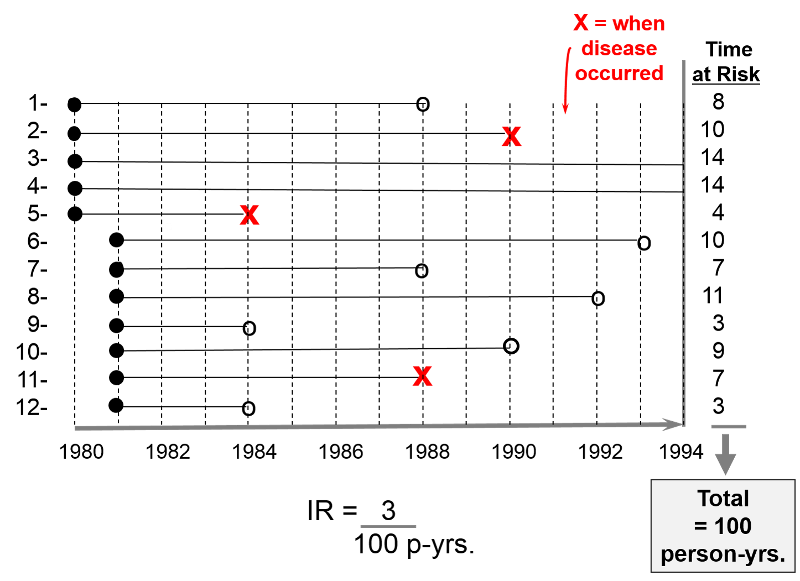
The first 5 subjects were enrolled in 1980, and the next 7 subjects were enrolled one year later. All subjects began taking aspirin upon enrollment. Therefore their "exposure" to aspirin began upon enrollment as indicated by the solid black dots.
The red "X"s indicate when subjects had a heart attack; their exposure time at risk ends there, since having a first heart attack means that they were no longer at risk of having a first heart attack; they had the outcome of interest at that point. Subject #2 had a heart attack in 1990; subject #5 had one in 1984; subject #11 had one in 1988.
The open circles indicated six subjects who were lost to follow-up. They stopped responding to all requests for follow up after that point. We know that they had not had a heart attack up to that point, but we don't know what happened to them after that, so they stop contributed observed exposure time at risk. Subject #1 was lost to follow up in 1988; #6 was lost in 1993; #7 was lost in 1988; #8 was lost in 1992; #9 was lost in 1984;
All of this information can be taken into account in order to compute the average rate at which heart attacks occur in this group of 12 men being treated with low-dose aspirin. We can do this in a way that is analogous to example #2 above. There were 3 heart attacks, and we divide this by the total amount of time that the men were exposed and at risk of developing a heart attack. For each man the exposure time at risk is the time from their entry into the study until one of three endpoints: a) the disease occurs, b) the subject is lost to follow-up, or c) the study concludes. The exposure time at risk for each man is shown in the column at the far right of the figure, and if we add these, the total exposure time for the group was 100 years. Therefore, the average rate at which the outcome occurred was 3/ 100 person-years of observed exposure time.
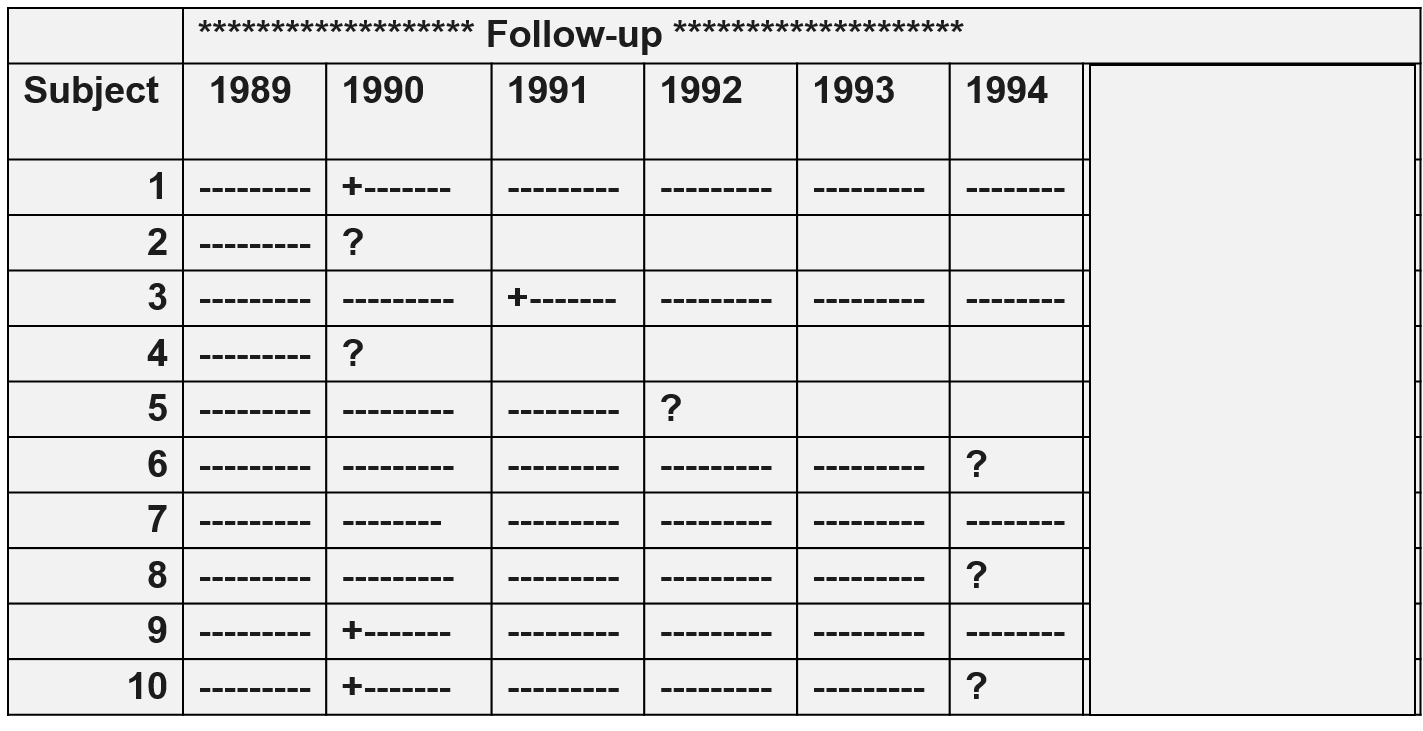
Question: A follow-up study was conducted to determine which sexual behaviors were associated with the greatest risk of becoming HIV+. The study was conducted in a group of female prostitutes. The subjects were tested prior to the beginning of the study, and HIV+ women were excluded. The women were retested at the beginning of January each year for the next six years. The table below summarizes the finding in 10 subjects. A plus sign (+) indicates when a subject was found to be HIV+; a question mark (?) indicates when a subject became lost to follow-up. Use this information to compute the incidence rate of becoming HIV+. Express your answer as the incidence per 100 person-years, and round off your answer to the nearest whole person. Text Description of the Table
Try doing these simple computations before you look at the answer.