Basic Quantitative Concepts
This module provides a brief review of quantitative concepts that are frequently used in public health. It has been designed, not as an extensive review of mathematics, but as a very focused summary of quantitative concepts that are useful in public health. Many students will find this refresher unnecessary, but students who have not had any quantitative courses in college may benefit from this review. This module should be mastered prior to matriculation.
After successfully completing this module, the student will be able to:
There are three commonly used means of indicating multiplication
There are three commonly used ways to indicate division.
44/123 = 0.3577
2+3 = 5
2+3 ≠ 4
(Read as "doesn't equal" or "is not equal to."
7 < 8
200 < 300
6 > 4
3000 > 2750
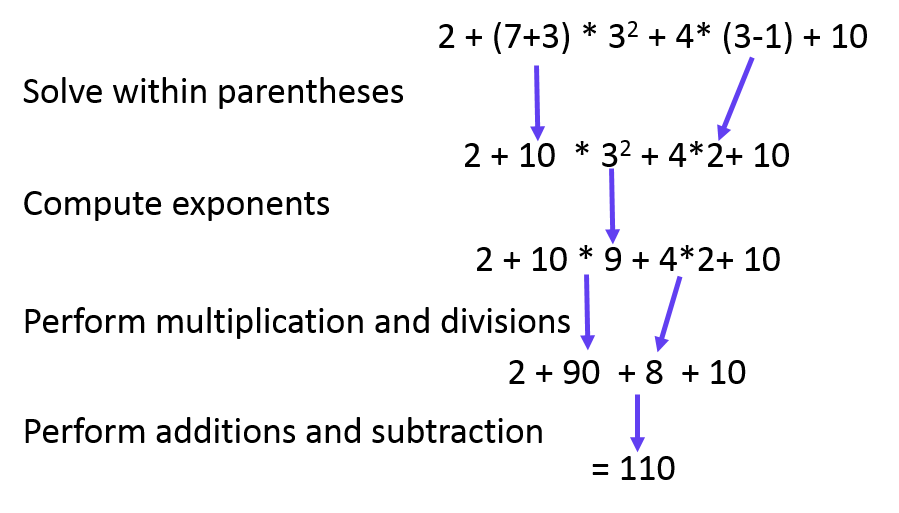
When you are given a mathematical expression or an equation, the order in which mathematical operations are performed is very important. The rules for this are quite simple. Consider the following example:
2 + (7+3) * 32 + 4* (3-1) + 10
At first this may look daunting, but it is really quite simple. The rules are: summarized in the table below.
|
Order of Operations
|
So, for the example above your would:
And the correct answer is 110.

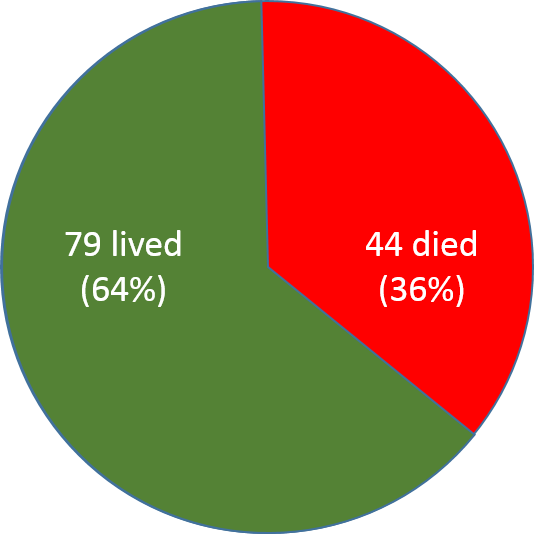
The British Medical Journal reported on 123 confirmed cases of H7N9 avian flu (bird flu) admitted to hospitals. They reported that 44 of these individuals died as a result of their infection. This proportion represents a case-fatality rate , and, like all proportions, it can be reported in several ways:
This decimal fraction can be computed manually, in a spreadsheet, on a simple hand-held calculator, or by using the calculator on a smart phone.
Visually we can represent this with the pie chart below.
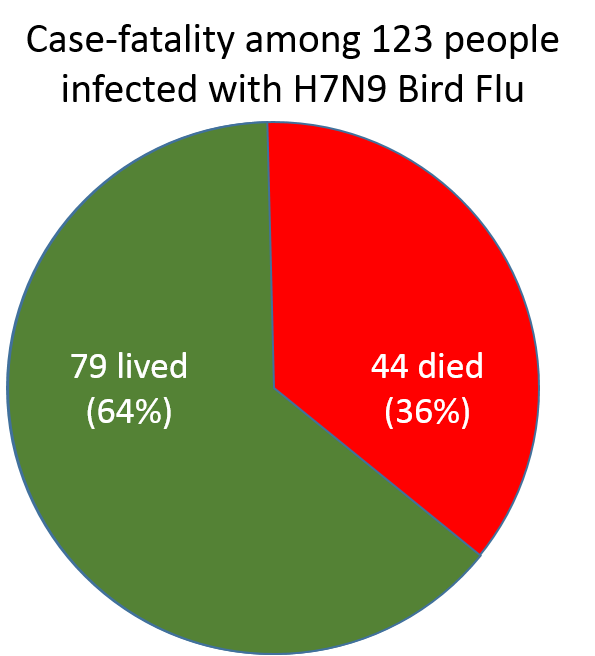
The sample consisted of 123 people with documented bird flu. The fraction of the sample that died was 44/123 = 0.36.
This can also be expressed at 36%. Percent means "per 100." It is a way of standardizing the results to make them easier to compare among different groups or at different times. The actual sample consisted of 123 people, but by expressing the case-fatality rate as a percent, we are saying that in a group of 100 people this frequency would be equivalent to 36 deaths.

Question: Data from the Massachusetts Department of Health indicates that in 2003 there were 8,263 people in Massachusetts known to be HIV positive. The estimated population size at the time was 5,700,000 (5.7 million). What was the estimated frequency of HIV expressed as a decimal fraction?
Answer

In this problem the frequency can be expressed as a simple fraction (8,263/5,700,000) or as the equivalent decimal fraction (0.00145). When we compute the decimal fraction, we divide the total number of HIV+ people by the total number of people in the population of Massachusetts. In fact, we are computing the prevalence of HIV seropositivity in Massachusetts. If we want to express this as a percentage, i.e., per 100 people, we would move the decimal point to the right by two places.
One can think of the decimal point as giving a frame of reference for the magnitude of what we are focusing on.
For example, consider the number 36.241983. This can be thought of as consisting of
3 tens,
6 ones,
2 tenths,
4 hundredths,
1 thousandth,
9 ten thousandths, and
8 hundred thousandths.

If we go back to the prevalence of HIV in Massachusetts, the decimal fraction provided the frequency per person (e.g., a probability of HIV+ of 0.00145 per person), but this is not an intuitive way to think about prevalence, and there are more convenient ways to express this, as summarized in the table below.
|
0.00145 per 1 person. 0.0145 per 10 persons 0.145 per 100 persons 1.45 per 1,000 persons 14.5 per 10,000 persons 145 per 100,000 persons |
Note that the third expression is "per 100," so this represents a percentage. However, if we wanted to communicate this information to the general public, it might be more intuitive to express this using either of the last two expressions, e.g., "Among 100,000 residents of Massachusetts, about 145 are known to be HIV positive." The first decimal fraction is what you would get when you divided (8,263/5,700,000); to convert this to the last expression, one moves the decimal point 5 places to the right to get 145 per 100,000. As easy way to remember this conversion is that we moved the decimal 5 places to the right to get a convenient whole number of people, and we expressed this as "per 100,000." Note that 100,000 has 5 "0"s after the 1, because we moved the decimal 5 places.
Percent change implies a starting value and an ending value. By convention the percent change is calculated by computing the change in value (i.e., the final value minus the starting value) and dividing the change by the starting value and multiplying the result times 100 in order to express it as a percentage.

Example 1: In 1960 the prevalence of type 2 diabetes was 10 per 1,000 population, and by 2010 the prevalence had increased to 60 per 1,000 population. What was the percent change?
% Change = (Final value - Starting Value) / Starting Value x 100
= [(60/1,000-10/1,000) / 10/1,000] * 100= [(60 - 10) / 10] * 100 = 5 * 100
= 500% increase
Example 2: Investigators created a risk reduction program for truck drivers in Kenya in order to decrease the spread of HIV and other sexually transmitted infections. During a one year follow up period the incidence of sexually transmitted diseases declined from
34 per 100 person years to 20 per 100 person-years. What was the percent change?
% Change = (Final value - Starting Value) / Starting Value x 100
= [(20/ 100 person-years - 34/100 person-years) / 34/100 PERSON-YEARS] * 100
= [-14 / 34] * 100
= - 0.41 * 100
= - 41%, i.e., it declined by 41%
Ratios are simply expressions of one measure relative to another. There are several types of ratios that are frequently used in public health.
Consider a class that has 20 male students and 80 female students. We can think about this in several ways. We could express this simply as the ratio of men to women and write the relationship as 20:80 or 20/80. We can also simplify this by dividing both the numerator and the denominator by a number that divides evenly into both the numerator and the denominator. In this case, we could divide both by 20 to simplify this to a 1:4 ratio (or 1/4 ratio). This indicates that for every man, there are four women.
We could also consider this from the inverse perspective, i.e., the number of women relative to the number of men; in this case the ratio of women to men is 80/20 which is equivalent to 4 to 1, i.e., there are four women for every man.
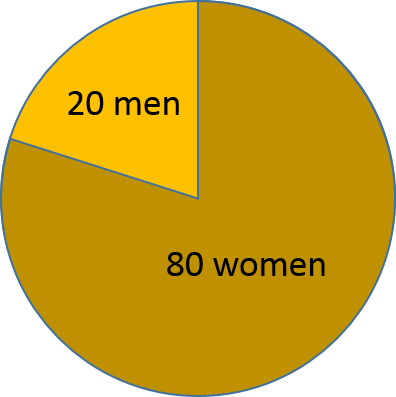
A proportion is a type of ratio that relates a part to a whole. For example, in the class with with 20 men and 80 women, the total class size is 100, and the proportion of men is 20/100 or 20%. The proportion of women is 80/100 or 80%. In both of these proportions the size of part of the class is being related to the size of the entire class. The class above conveniently had a total size of 100, but this usually isn't the case.
If we go back to the information on mortality from bird flu that was presented on the previous page, it can be seen that there are several ways of thinking about this basic information.
The fact that 44 died and the other 79 lived could be expressed as a simple ratio, which compares the number who died to the number who survived. 44/79 or 44:79 would be two ways of expressing this simple ratio. The ratio of those who died relative to those who lived was 44 to 79.
Alternatively, we might want to focus on the proportion who lived. In total, 123 people were infected, and 44 of these died. Therefore, the proportion who died was 44/123, which could be expressed as a decimal fraction (0.36) or as a percentage (36%). This proportion is referred to as the "case-fatality" rate, although strictly speaking, it is a proportion and not a rate.
|
|
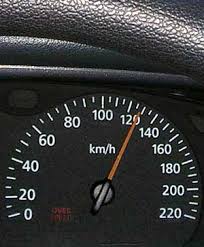
Rates are a special type of ratio that incorporate the dimension of time into the denominator. Familiar examples include measurements of speed (miles per hour) or water flow (gallons per minute). Example #1: If a car travels 24 miles in 2 hours, its average speed is a rate of 24 miles/ 2 hours = 12 miles/hr. Example #2: Suppose a car traveled 24 miles in 2 hours, then continued and traveled miles in 3 hours, and then another 12 miles in 1 hour. We can compute the average rate of speed for the entire trip by adding up the total distance covered and dividing it by the total time that the trip took. Average speed for the trip = (24 miles + 24 miles + 12 miles) / (2 hour + 3 hours +1 hour) = 60 miles / 6 hours = 10 miles per hour |
Note that some commonly used measurements of health outcomes are referred to as "rates" even though they are actually proportions.
For example:
Strictly speaking, these are all proportions, but incidence rates or incidence density is a measurement of the frequency of a health outcome that is more like a true rate. An incidence rate basically quantifies the number of health outcomes and the total exposure time (i.e., time at risk) in a group or population. Similar to computation of an average speed for an automobile, an incidence rate is computed by dividing the total number of health-related events that occurred by the total exposure time at risk for the group.
For example, consider a hypothetical clinical trial that was conducted to determine whether taking low-dose aspirin reduced the frequency of heart attacks in middle-aged and elderly men. The time line below summarizes events 12 subjects labeled 1-12, all of whom were allocated to the placebo-treated group.
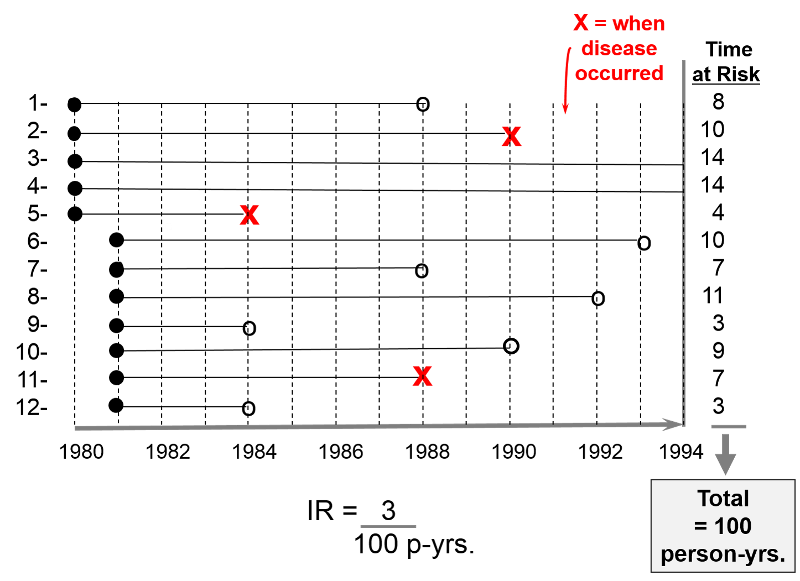
The first 5 subjects were enrolled in 1980, and the next 7 subjects were enrolled one year later. All subjects began taking aspirin upon enrollment. Therefore their "exposure" to aspirin began upon enrollment as indicated by the solid black dots.
The red "X"s indicate when subjects had a heart attack; their exposure time at risk ends there, since having a first heart attack means that they were no longer at risk of having a first heart attack; they had the outcome of interest at that point. Subject #2 had a heart attack in 1990; subject #5 had one in 1984; subject #11 had one in 1988.
The open circles indicated six subjects who were lost to follow-up. They stopped responding to all requests for follow up after that point. We know that they had not had a heart attack up to that point, but we don't know what happened to them after that, so they stop contributed observed exposure time at risk. Subject #1 was lost to follow up in 1988; #6 was lost in 1993; #7 was lost in 1988; #8 was lost in 1992; #9 was lost in 1984;
All of this information can be taken into account in order to compute the average rate at which heart attacks occur in this group of 12 men being treated with low-dose aspirin. We can do this in a way that is analogous to example #2 above. There were 3 heart attacks, and we divide this by the total amount of time that the men were exposed and at risk of developing a heart attack. For each man the exposure time at risk is the time from their entry into the study until one of three endpoints: a) the disease occurs, b) the subject is lost to follow-up, or c) the study concludes. The exposure time at risk for each man is shown in the column at the far right of the figure, and if we add these, the total exposure time for the group was 100 years. Therefore, the average rate at which the outcome occurred was 3/ 100 person-years of observed exposure time.
Question: A follow-up study was conducted to determine which sexual behaviors were associated with the greatest risk of becoming HIV+. The study was conducted in a group of female prostitutes. The subjects were tested prior to the beginning of the study, and HIV+ women were excluded. The women were retested at the beginning of January each year for the next six years. The table below summarizes the finding in 10 subjects. A plus sign (+) indicates when a subject was found to be HIV+; a question mark (?) indicates when a subject became lost to follow-up. Use this information to compute the incidence rate of becoming HIV+. Express your answer as the incidence per 100 person-years, and round off your answer to the nearest whole person. Text Description of the Table
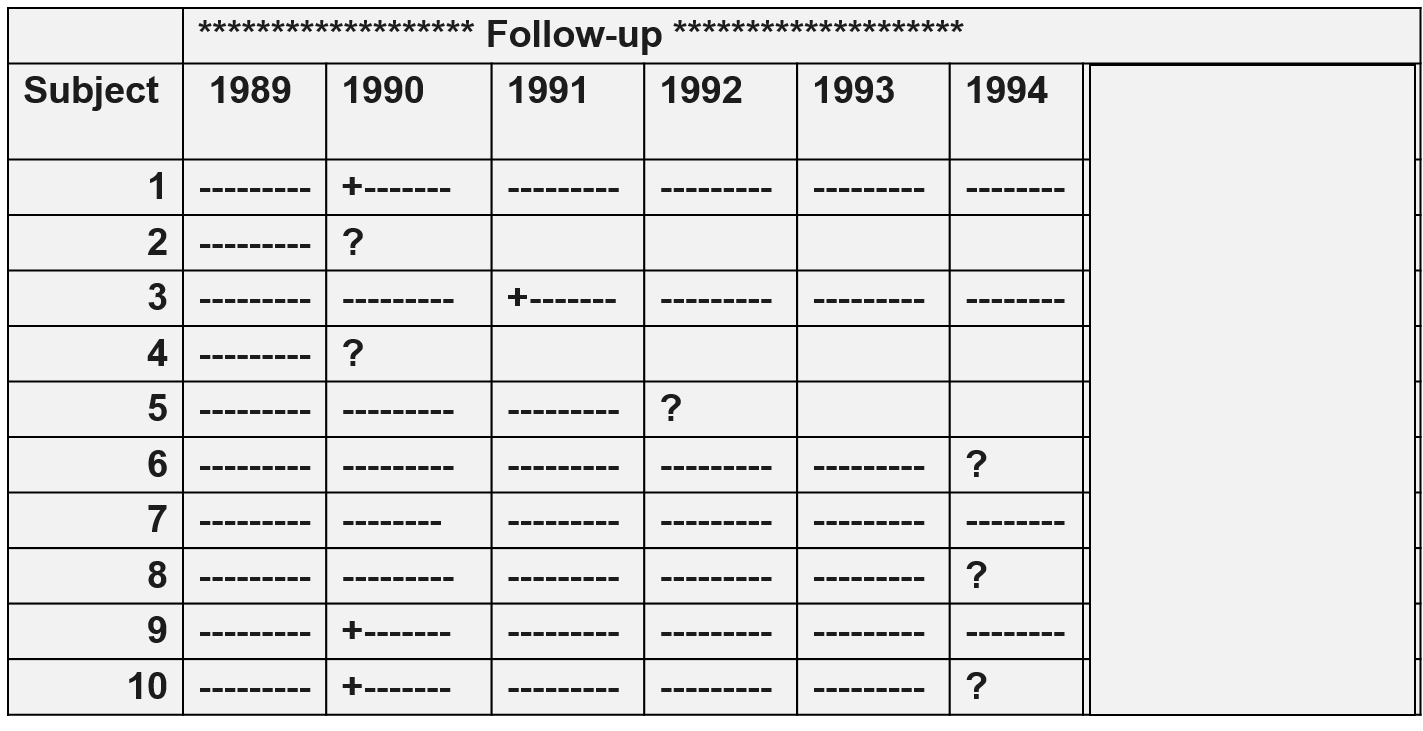
Try doing these simple computations before you look at the answer.
Answer
In this section we will review some of the simple, basic concepts for solving algebraic equations. It is often possible to express quantitative problems with algebraic equations or expressions. This provides a useful shorthand way of laying the problem out in a way that makes it easier to see relationships, identify the information that is needed, and then solve the problem. The steps illustrated here provide some very simple, fundamental operations that can facilitate your ability to simplify algebraic expressions and then solve them to determine the value of the unknown variables that hold the answer to the problem.
Example:
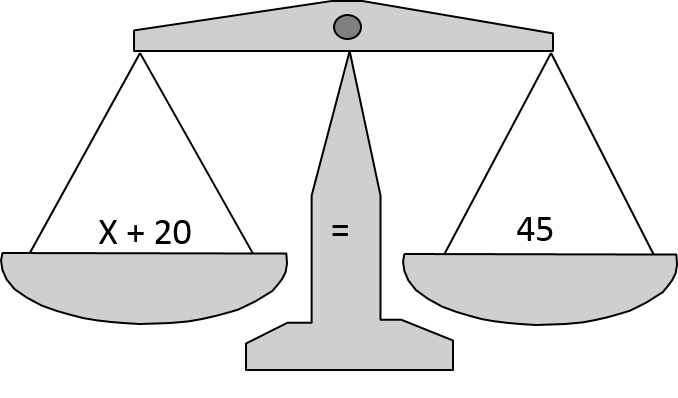
Consider the simple equation x + 20 = 45. The equal sign indicates that the two sides of the equation are equivalent or equally balanced. This means that we can manipulate the equation, and, provided we do the same thing to both sides of the equation, the balance will not be upset.
In this simple example we could subtract 20 from both sides of the equation:
x + 20 -20 = 45 - 20
20 - 20 is zero, so this can be simplified to:
x = 25
Thus, we have solved the equation for "x."
Here is another example:
x + 23 = 2x + 45
In this case, the right side has the expression "2x," meaning "2 times x." So, the 2 can be thought of as a "coefficient" indicating what the variable "x" is being multiplied by.
To simplify this equation, we can start by subtracting one "x" from both sides.
x - x + 23 = 2x - x +45
This simplifies to:
23 = 1x +45
Next, we can subtract 45 from both sides in order to get the right side to just have "x" left::
23 - 45 = x + 45 - 45
This simplifies to
-22 = x
So, x = - 22.
Suppose 4x = 48
Since we want to find the value of the variable "x," we can just divide both sides of the equation by 4. Remember that as long as we do the same thing to both sides, the equation remains balanced.
Here are the steps:
Divide both sides of the equation by 4.
The 4s on the left side of the equation cancel each other out, leaving just "x".
On the right side of the equation 48/4 =12.
Therefore, x = 12.

Consider the following equation:
2 + 3x + 2x + 8 = 60
The goal is to find the value of "x." The left side of the equation has four terms that are to be added, but the order in which additions occur doesn't matter, so we can rearrange this to the following:
2 + 8 + 3x + 2x = 60
and we can now add the first two terms and combine the last two terms on the left side.
10 + 5x = 60
Next, we can subtract 10 from both sides of the equation.
5x = 50
And then divide both sides of the equation by 5 to solve for x.
x = 10
Consider the following equation:
6(2 + 4x) = 60
This indicates that we are to multiply 6 times the quantity inside the parentheses. In the section describing the order in which mathematical operations are performed we saw that the first step is to solve within parentheses, but in this case we have two dissimilar terms within the parentheses. However, we can get around this problem by distributing the multiplier (i.e., 6) over the two terms inside the parentheses as follows:
6(2) + 6(4x) = 60
This can be simplified to:
12 + 24x = 60
Now we can subtract 12 from both sides of the equation:
24x = 48
And finally, divide both sides of the equation by 24:
x = 2
You can think of exponents as a shorthand notation indicating "power" or the number of times a quantity is multiplied times itself. Exponential or "scientific notation" provides a much easier way to express and think about very large or very small quantities. In addition, an understanding of exponents and logarithms is essential to effective use of methods such as multiple logistic regression.
Examples:
2 * 2 = 22 (Read as "two squared") = 4
2*2*2 = 23 (Read as "two cubed") = 8
85 = 8*8*8*8*8 = 32,768
Logarithms are the "opposite" or the inverse of exponentials. In a sense logarithms undo what exponentiation does.
Suppose that if one raises a base number "b" to the "x" power, the result is "y". If so, then the log (for base b) of "y" is "x".Another way to think about logarithms is that a positive logarithm is how many times you have to multiple the base to get a particular number.
For example:
24 = 2*2*2*2 =16, i.e., the base number 2 exponentiated to the 4th power is 16.
This relationship could also be expressed as
log2(16) = 4, meaning the base 2 log of 16 is 4, i.e., in order to get 16, one would have to raise the base number 2 to the 4th power.
Conversely, a negative logarithm is how many times you multiple by the inverse of the base to get the number. For example,
Log10(0.001)= - 3, i.e., 1/10*1/10*1/10 = 1/1,000
Another example: log6(216) = ?
This asks, to what power would the base number 6 need to be raised in order to get 216? We can start multiplying 6 to determine that 6*6 = 36 and 36*6 = 216. So, the answer is 3. One would have to raise the base 6 to the 3rd power to get 216.
This could be expressed with these two equivalent statements:
y = bx is equivalent to logb(y) = x
The value of the subscripted "b" is the base of the logarithm. There are many possible "bases" that can be used, but there are two bases that are particularly useful in practical terms.
Common logs use the base 10. They are for some scales, for example those that measure acidity (pH scale), sound amplitude (decibel scale), and the intensity of earthquakes (the Richter scale). One way to think about common logs is that a positive logarithm is how many times you have to multiple the base to get a particular number. For example:
| Number
|
Exponential Expression
|
Logarithm (base 10)
|
|---|---|---|
|
1000 |
103 |
3 |
|
100 |
102 |
2 |
|
10 |
101 |
1 |
|
1 |
100 |
0 |
|
1/10 = 0.1 |
10-1 |
-1 |
|
1/100 = 0.01 |
10-2 |
-2 |
|
1/1000 = 0.001 |
10-3 |
-3 |
Acidity is based on the molar concentration of hydrogen ions in a solution, and it is defined as:
pH = -log10 [Hydrogen ion concentration]
Example: What is the pH of an aqueous solution when the concentration of hydrogen ion is 5.0 x 10⁻⁴ M?
pH = -log [H+] = -log (5.0 x 10⁻⁴) = - (-3.30) = 3.30
Pure water has a pH value of 7. Since acidity is based on a log10 scale, another way of thinking about this is that each whole pH value below 7 is ten times more acidic than the next higher value. For example, urine generally has a hydrogen ion concentration 10 times greater than that of pure water, and -log10 [10] = -1, so the pH of urine is 7-1 = 6.
The same holds true for pH values above 7, each of which has a hydrogen ion concentration ten times less than that the next lowest pH unit.
Exponential notation, or scientific notation, is sometimes used to describe disease frequency. We previously computed the prevalence of HIV+ residents of Massachusetts in 2003. Recall that there were 8,263 HIV+ people living in Massachusetts. The total population of Massachusetts, based on census data, was 5.7 million. The prevalence of a condition is the proportion of the population (or group) that has the condition. Therefore, the prevalence of HIV in Massachusetts in 2003 can be calculated with a hand-held calculator or a spreadsheet:
8,263 / 5,700,000 = 0.001449649122807
In essence, the decimal fraction that results represents the frequency per resident, which is certainly not an intuitive way to think about prevalence in a population. It would make much more sense to think about this as the number of people who were HIV+ in some representative group, say per 10,000 residents or perhaps per 100,000 residents. In addition, the calculator has extended the results of the division to a ridiculous number of decimal places. We can simplify this by first rounding off the result.
0.001449649122807 can be rounded off to 0.00145
Next, we can convert this to a more intuitive expression. The decimal fraction is the frequency per person; If we want to express it as the frequency per 10,000 residents, we would multiply by 100,000 by moving the decimal point to the right 5 places.

Note that this can be expressed in exponential, i.e.,scientific, notation as 1.45 x 10 -3 or 14.5 x 10⁻⁴ or as 145 x 10-5 which is equivalent to 145 per 100,000 residents. All of these are equivalent expressions.
0.00145 = 145 x 10-5 = 145 per 100,000 residents
Natural logs use a special base which turns out to be very useful when dealing with exponential growth or decay. Natural logs use the base "e" which is a constant with an approximate value of 2.71828. Like the constant "pi" (p), "e" is an irrational number that goes on forever when expressed as a decimal.
Expressed another way:
|
From http://betterexplained.com/articles/an-intuitive-guide-to-exponential-functions-e/
"e is the base rate of growth shared by all continually growing processes. e lets you take a simple growth rate (where all change happens at the end of the year) and find the impact of compound, continuous growth, where every nanosecond (or faster) you are growing just a little bit. e shows up whenever systems grow exponentially and continuously: population, radioactive decay, interest calculations, [etc.]"
For example:
|
e3 = 2.71828 * 2.71828 * 2.71828 = 20.085496, and conversely, loge(20.085496) = 3
However, to avoid confusion the natural log of "x" is written as "ln(x)" rather than loge(x), the preceding expression would be written ln(20.085496) = 3.
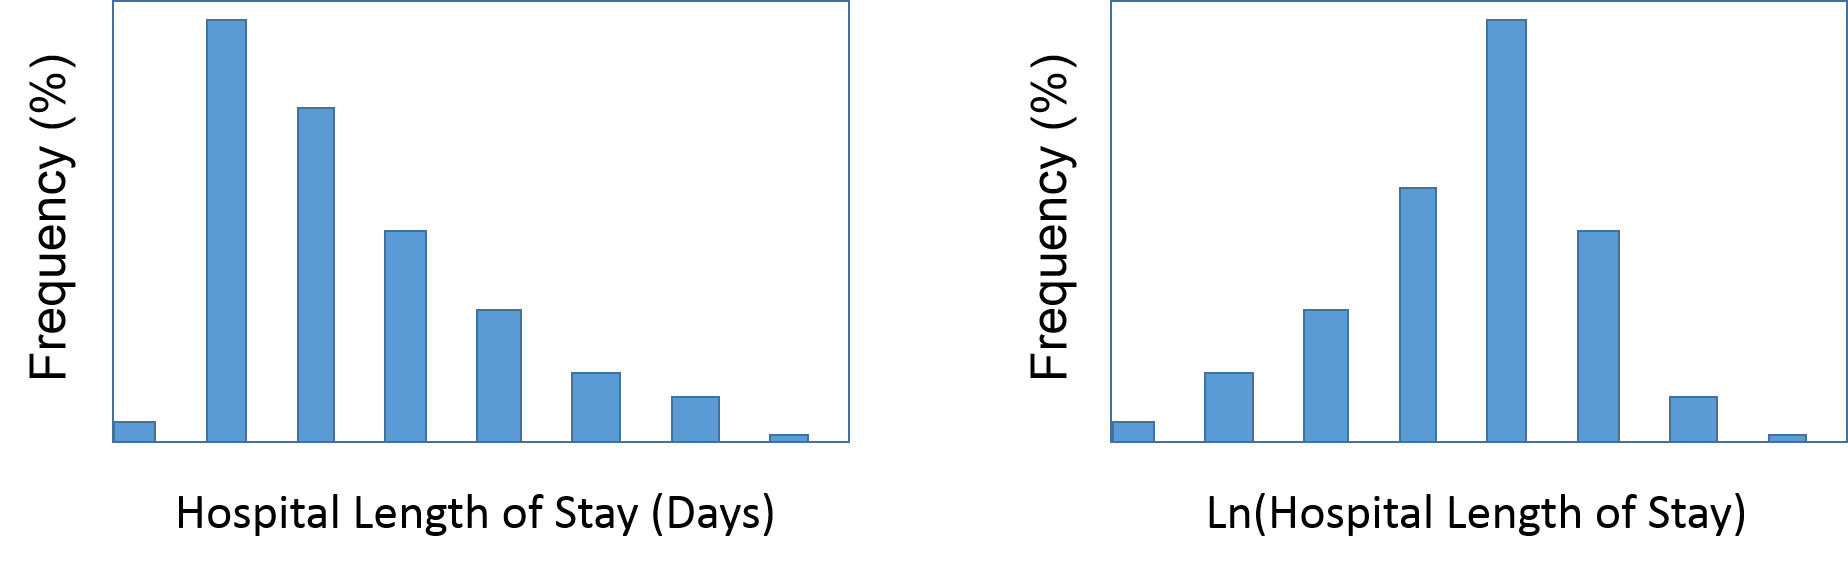
It is often desirable to estimate the precision of estimates used in public health, such as risk ratios and odds ratios. Techniques for evaluating precision rely on the assumption that the values are normally distributed, i.e. that the distribution of possible values is similar to a bell-shaped curve. However, estimates of risk ratios and odds ratios are generally not normally distributed; they are skewed toward a value of 1, but could be much higher. One of the common methods of "normalizing" distributions like this is to transform the data into a logarithmic distribution. For example, if we examined the frequency of hospital length of stay for most conditions, we would find that it generally conformed to a distribution that is skewed toward shorter lengths of stay with progressively fewer patients having longer stays. However, taking the natural logarithm of length of stay tends to make the distribution more symmetrical.
As a result, estimation of the precision of some parameters in public health is facilitated by the use of natural logarithms.
Video (5 min)