

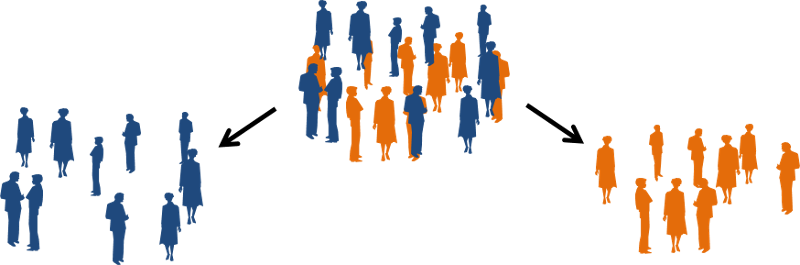
Stratification to Control for Confounding
If age, for example, is a confounding factor when evaluating an association, another strategy is to evaluate the association in different age groups and calculate the measure of association in each stratum of age.
For example, if age is a confounder of the relation between physical activity and CHD, we could stratify the analysis into separate age groups in order to evaluate the association between activity and CHD separately for each age group. The table below shows a hypothetical example.
| CHD | No CHD | Total | |
|---|---|---|---|
| Active | 48 | 800 | 848 |
| Not active | 69 | 625 | 694 |
The crude risk ratio is (48/848) / (69/694) = 0.57.
If we are concerned about confounding by age, we could restrict the analysis to young subjects (arbitrarily defined as less than 45 years of age), or we could restrict it to older subjects (45 years or older). However, a better option would be to enroll young and old subjects, but analyze them separately, i.e., a stratified analysis. To do this we need to have recorded each subjects age, i.e., we need to have data on confounding factors, and, since age is continuously distributed, we need to collapse ages into categories. For the sake of illustration, we will collapse age into just two categories here, although breaking the data into five year intervals would give better control of confounding.
The stratified analysis might look like this with younger subjects on the left and older subjects on the right:
|
|
Younger (<45) |
Older (≥45) |
||||||
| CHD | No CHD | Total | CHD | No CHD | Total | |||
| Active | 25 | 600 | 625 | Active | 23 | 200 | 223 | |
| Not active | 11 | 225 | 236 | Not | 58 | 400 | 458 | |
RRyoung = 0.86 RRold = 0.81
Notice that when the data is stratified this way, it becomes apparent that most of the young subjects were active, and most of the older subjects were not. By stratifying the analysis in this fashion, we have reduced confounding by disentangling the effects of activity and age. The contingency table for the young shows the effect of activity on CHD risk in the young without the additional risk factor of older age. Similarly, the analysis of the older subjects shows the effect of activity on CHD risk in the older group without the inclusion of younger people whose inherent risk of CHD is less.
Also notice that the stratum-specific risk ratios are similar to one another, although both are less than the crude risk ratio. Therefore, the effect of activity in reducing the risk of CHD is similarly in both age groups, but the effect is not as strong as the crude risk ratio suggested.
The analysis above stratified by age into only two groups for simplicity. However, using just two broad ranges of age would probably result in residual confounding, because the age-related risk of CHD might vary quite a lot between the ages of 45-80 in the older group. Better control of confounding could be achieved by stratifying more finely, perhaps at five year intervals of age.
Residual Confounding
Residual confounding is confounding that persists despite efforts to control or adjust for confounding. There are several causes for residual confounding:
- Unknown confounders or failure to collect data on possible confounders
- Inaccurate data on a confounder
- Use of broad categories of a confounder in the analysis. For example, controlling for age by stratifying into "young" and "old" would like result in residual confounding; it would be better to stratify at 5 or 10 year age intervals
The Mantel-Haenszel Pooled Estimate
When the stratum-specific estimates of effect (RR or OR) are similar, as in the example above, one can combine them into a single summary measure of association that is adjusted for confounding by the stratified variable. This is most commonly done using a Mantel-Haenszel equation to compute a weighted average, i.e., a pooled estimate of the stratum-specific risk ratios (or odds ratios). The adjusted estimate is often reported as RRMH or ORMH (i.e., an adjusted measure of association). For the example, above,
RRMH=0.84
[Note: You will not need to compute Mantel-Haenszel estimates in this course, but you will be expected to interpret them.]
The Magnitude of Confounding
With a pooled estimate we can now compute the magnitude of confounding as we did in the discussion of standardization.


For Activity and CHD:

The crude estimate of the risk ratio and the adjusted estimate differed by 32%. Using the 10% rule for confounding, we can conclude that there is clear evidence of confounding by age.
|
Stratified analysis is a straightforward and effective way to control for confounding. Its chief limitation is that it cannot effectively control for confounding by multiple variables simultaneously, because stratifying by additional layers for each confounder is limited by sample size. Multiple variable regression is a better method for controlling for multiple confounding factors simultaneously, but a series of stratified analyses stratified one possible confounder at a time is a good way to get a sense of which other factors might cause confounding (or effect measure modification) prior to embarking on multiple variable regression (Effect Measure Modification is explained on page 8).
|
Analyzing the Physical Activity-CHD Problem with Standardization
We also could have computed a risk ratio adjusted for confounding by age using standardization. In the table below the data has been rearranged to facilitate this.
|
Physically Active |
Sedentary |
|||||||||
| CHD | Population | % pop. | Rate | CHD | Population | % pop. | Rate | |||
| Young | 25 | 625 | 0.737 | 0.0400 | Young | 11 | 236 | 0.340 | 0.0466 | |
| Old | 23 | 223 | 0.263 | 0.1031 | Old | 58 | 458 | 0.660 | 0.1266 | |
| TOTAL | 48 | 848 | 1 | 69 | 694 | 1 | ||||
Note that only 26.3% of the "active" population is old, but 66% of the inactive population is old, and old subjects have more than 2 times the risk of CHD compared to the young subjects.
I can use the proportions of young and old subjects in the physically active group as standard weights and apply these proportions to the sedentary group to compute an adjusted rate for the sedentary group that estimates what their overall rate would have been if their age distribution had been the same as the active group.
CHD Rate active adj.=0.737(0.04)+0.263(0.1031)=0.0566
CHD Rate sedentary adj.=0.737(0.0466)+0.263(0.1266)=0.0678
Adjusted Risk Ratio = 0.0566/0.0678 = 0.837, essentially the same value when the Mantel-Haenszel equation was used.