


Exercise 3 - Solving an Outbreak of Hepatitis A (Case-Control Study)
In the handouts on the right side, open the Excel file call "Hepatitis Outbreak". Save this file to your local computer or thumb drive.
This file contains actual data from investigation of a hepatitis outbreak that occurred in Marshfield, MA in 2004. There were 20 cases reported within a short period of time. The Massachusetts Department of Public Health was asked to investigate the outbreak. Descriptive epidemiology, including hypothesis-generating interviews, suggested that the source was most likely a food handler at one of several possible food establishments.
The investigators conducted a case-control study. They created a questionnaire and collected data from 19 cases and 38 controls. The controls were matched to the cases by age group and by neighborhood of residence. The data is in the first worksheet in the Excel file above. Note that the data indicating whether the subjects were cases or control are inconsistent, with a variety of responses indicating yes or no. The same is true for the data indicating which food establishments they were exposed to.
- Your first task is to clean up the data set. When you have dichotomous data (e.g., yes or no), the most unambiguous way to enter the data is to use the numbers 0 (for no) and 1 (for yes). Select the block of data from B3 to M59, which includes all of the cases and all of the controls. Use the Replace function on the far right hand side of the Home menu to replace all of the "y"s with 1, then all of the "Yes" with 1, etc., until all of the dichotomous fields have been converted into 0 or 1 as appropriate.
- Next, sort the data by "Case" status in column B.
- The controls, i.e., case=0, should be on top if you sorted in ascending order. Now find where the controls end and the cases begin, and insert 3 or 4 blank rows between the cases and controls. From the Home menu, select rows 41-44 and click on "Insert" in the cells section of the toolbar options. This should insert 4 blank rows.
- Now use two of the rows beneath the controls to create rows for =COUNT and =SUM in cells E41 and E42 respectively.
- Then replicate the formulas in E41 and E41 to the right to replicate the formulas into the columns for the other restaurants.
- Repeat the two previous steps beneath the cases, and save your work.
You now have the information you need to compute odds ratios and 95% confidence intervals for each of the food establishments.
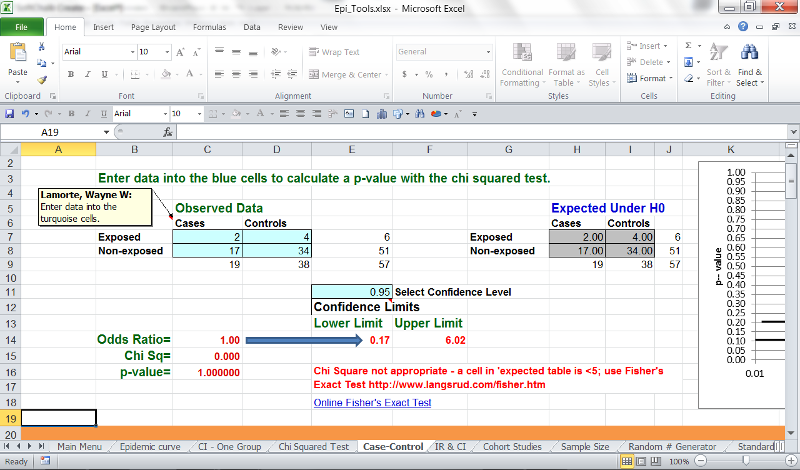
- You can open and save "Epi-Tools.XLS" from the Handouts on the right side of the Spreadsheet module. This is an Excel file that contains multiple worksheets that have been pre-programmed to perform selected analyses. Note that there is a worksheet for Case-Control" studies. Click on the tab to go to this worksheet, and use the blue-green 2x2 table to enter the number of exposed and unexposed cases and controls, based on the results of your =COUNT and =SUM tallies in the hepatitis spreadsheet. For example, the counts for Brian's Place indicate that 2 of the 19 cases ate there, and 4 of the 38 controls ate there. So, in the cells for the cases you would enter 2 and 17 (19 total), and for the control column you would enter 4 and 34 (total 38). The odds ratio and confidence interval get calculated automatically once you click on a cell outside the 2x2 table.