


Attributable Proportion
Attributable Proportion Among the Exposed
(Also called the Attributable Fraction or the Attributable Risk %)
The same information allows you to calculate the proportion of disease in the exposed group that can be attributed to the exposure. This can also be looked at as the proportion of disease in the exposed group that could be prevented by eliminating the risk factor. It is calculated by taking the risk difference, dividing it by the incidence in the exposed group, and then multiplying it by 100 to convert it into a percentage.

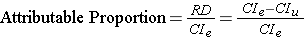
Attributable proportion can also be expressed as a percent, i.e., the percentage of disease in the exposed group that can be attributed to the exposure (sometimes called the attributable risk %). The calculation is the same, except you multiply x 100 to convert the proportion into a %.
Example:
In the wound infection study, the incidence in the exposed group was 5.3 per 100. Of this, 4 per 100 could be attributed to having had the incidental appendectomy (the other 1.3 per 100 was the "inherent risk" of the staging laparotomy). Therefore,

so 75% of the wound infections in the group that had the incidental appendectomy could be attributed to having had the appendectomy.

Consider the following table [adapted from Rothman: Epidemiology - An Introduction], and compute the attributable proportion in the exposed group.Do the calculation following the example above before you look at the answer.
|
Exposure Status |
Diseased |
No Disease |
Population |
|
Cumulative Incidence (Risk) |
|---|---|---|---|---|---|
|
Exposed |
500 |
9,500 |
10,000 |
|
0.050 |
|
Not Exposed |
900 |
89,100 |
90,000 |
|
0.010 |
|
Column Totals |
1,400 |
98,600 |
100,000 |
|
0.014 |
Sometimes you will not have the actual cumulative incidence or incidence rates available, but will know the risk or rate ratio. In that case, it is very helpful to know this alternative formula for calculating the attributable proportion:

For example, the RR in the laparotomy study was 4.2. Plugging this value into the above formula gives (4.2 - 1)/4.2 = 3.2/4.2 = 76%, which differs only by rounding error from the result obtained using the other formula.
Question: Is it possible to compute the attributable proportion in the exposed from incidence rates?
The "Preventive Fraction"
The attributable proportion makes sense when one is dealing with an exposure that increases the risk of a disease. The flip side of this is the situation when one is dealing with an exposure that reduces the risk of disease. In this case, it makes more sense to think about the preventive fraction (or proportion).
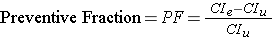
This is similar to the attributable proportion, except that the risk difference (i.e., the risk reduction) is divided by the cumulative incidence in the unexposed group. This can also be expressed as a percent, i.e., the percentage of disease reduction in the exposed group that can be attributed to the beneficial exposure.
Example:
In 1945 Newburgh, New York and two other communities began fluoridating their public water supply. As a result, the incidence of dental caries was 14.8% versus 21.3% in nearby Kingston, NY, which was non-fluoridated. Thus, the preventive fraction was (21.3-14.8)/21.3 = 30.5%, indicating that about 30% of the caries that would have occurred in Newburgh were prevented by fluoridation.
