


Computing Percentiles
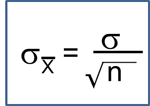
The standard normal distribution can also be useful for computing percentiles . For example, the median is the 50th percentile, the first quartile is the 25th percentile, and the third quartile is the 75th percentile. In some instances it may be of interest to compute other percentiles, for example the 5th or 95th. The formula below is used to compute percentiles of a normal distribution.

where μ is the mean and σ is the standard deviation of the variable X, and Z is the value from the standard normal distribution for the desired percentile.
Example:
- The mean BMI for men aged 60 is 29 with a standard deviation of 6.
- The mean BMI for women aged 60 the mean is 28 with a standard deviation of 7.
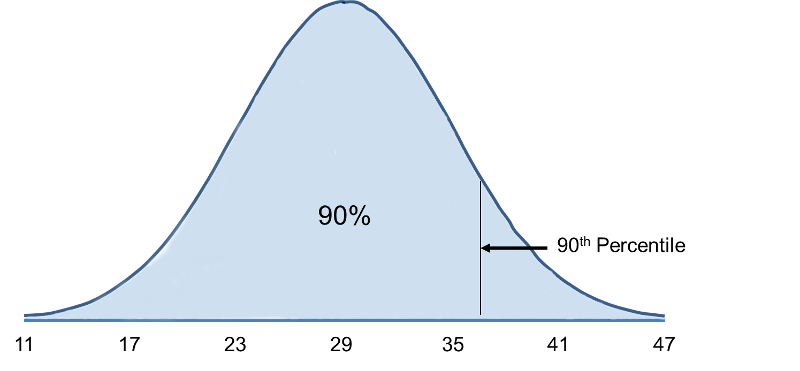
What is the 90th percentile of BMI for men?
The 90th percentile is the BMI that holds 90% of the BMIs below it and 10% above it, as illustrated in the figure below.
To compute the 90th percentile, we use the formula X=μ + Zσ, and we will use the standard normal distribution table, except that we will work in the opposite direction. Previously we started with a particular "X" and used the table to find the probability. However, in this case we want to start with a 90% probability and find the value of "X" that represents it.
So we begin by going into the interior of the standard normal distribution table to find the area under the curve closest to 0.90, and from this we can determine the corresponding Z score. Once we have this we can use the equation X=μ + Zσ, because we already know that the mean and standard deviation are 29 and 6, respectively.
When we go to the table, we find that the value 0.90 is not there exactly, however, the values 0.8997 and 0.9015 are there and correspond to Z values of 1.28 and 1.29, respectively (i.e., 89.97% of the area under the standard normal curve is below 1.28). The exact Z value holding 90% of the values below it is 1.282 which was determined from a table of standard normal probabilities with more precision.
Using Z=1.282 the 90th percentile of BMI for men is: X = 29 + 1.282(6) = 36.69.
Interpretation: Ninety percent of the BMIs in men aged 60 are below 36.69. Ten percent of the BMIs in men aged 60 are above 36.69.

What is the 90th percentile of BMI among women aged 60? Recall that the mean BMI for women aged 60 the mean is 28 with a standard deviation of 7.
The table below shows Z values for commonly used percentiles.
|
Percentile |
Z |
|---|---|
|
1st |
-2.326 |
|
2.5th |
-1.960 |
|
5th |
-1.645 |
|
10th |
-1.282 |
|
25th |
-0.675 |
|
50th |
0 |
|
75th |
0.675 |
|
90th |
1.282 |
|
95th |
1.645 |
|
97.5th |
1.960 |
|
99th |
2.326 |
Percentiles of height and weight are used by pediatricians in order to evaluate development relative to children of the same sex and age. For example, if a child's weight for age is extremely low it might be an indication of malnutrition. Growth charts are available at http://www.cdc.gov/growthcharts/.
For infant girls, the mean body length at 10 months is 72 centimeters with a standard deviation of 3 centimeters. Suppose a girl of 10 months has a measured length of 67 centimeters. How does her length compare to other girls of 10 months?
A complete blood count (CBC) is a commonly performed test. One component of the CBC is the white blood cell (WBC) count, which may be indicative of infection if the count is high. WBC counts are approximately normally distributed in healthy people with a mean of 7550 WBC per mm3 (i.e., per microliter) and a standard deviation of 1085. What proportion of subjects have WBC counts exceeding 9000?
Using the mean and standard deviation in the previous question, what proportion of patients have WBC counts between 5000 and 7000?
If the top 10% of WBC counts are considered abnormal, what is the upper limit of normal?
Percentile Calculator
![]()
![]()