


Application of the Central Limit Theorem
Cholesterol molecules are transported in blood by large macromolecular assemblies (illustrated below) called lipoproteins that are really a conglomerate of molecules including apolipoproteins, phospholipids, cholesterol, and cholesterol esters. This macromolecular carrier particles make it possible to transport lipid molecules in blood, which is essentially an aqueous system.
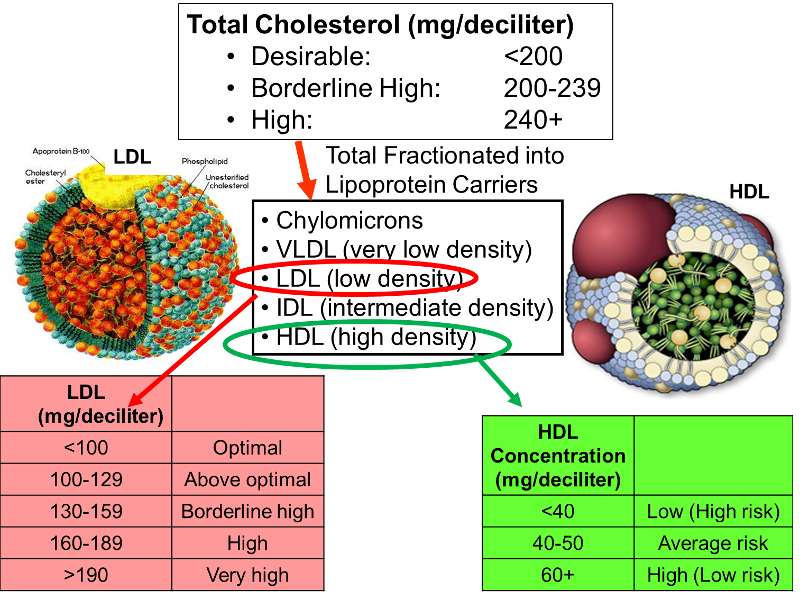
Different classes of these lipid transport carriers can be separated (fractionated)based on their density and where they layer out when spun in a centrifuge. High density lipoprotein cholesterol (HDL) is sometimes referred to as the "good cholesterol," because higher concentrations of HDL in blood are associated with a lower risk of coronary heart disease. In contrast, high concentrations of low density lipoprotein cholesterol (LDL) are associated with an increased risk of coronary heart disease. The illustration on the right outlines how total cholesterol levels are classified in terms of risk, and how the levels of LDL and HDL fractions provide additional information regarding risk.
Example:
Data from the Framingham Heart Study found that subjects over age 50 had a mean HDL of 54 and a standard deviation of 17. Suppose a physician has 40 patients over age 50 and wants to determine the probability that the mean HDL cholesterol for this sample of 40 men is 60 mg/dl or more (i.e., low risk). Probability questions about a sample mean can be addressed with the Central Limit Theorem, as long as the sample size is sufficiently large. In this case n=40, so the sample mean is likely to be approximately normally distributed, so we can compute the probability of HDL>60 by using the standard normal distribution table.
The population mean is 54, but the question is what is the probability that the sample mean will be >60?
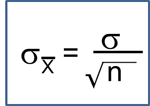
In general,


the standard deviation of the sample mean is

Therefore, the formula to standardize a sample mean is:
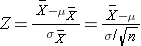
And in this case:
P(Z > 2.22) can be looked up in the standard normal distribution table, and because we want the probability that P(Z > 2.22), we compute is as P(Z > 2.22) = 1 - 0.9868 = 0.0132.
Therefore, the probability that the mean HDL in these 40 patients will exceed 60 is 1.32%.

What is the probability that the mean HDL cholesterol among these 40 patients is less than 50?
Example:
Suppose we want to estimate the mean LDL cholesterol) in the population of adults 65 years of age and older. We know from studies of adults under age 65 that the standard deviation is 13, and we will assume that the variability in LDL in adults 65 years of age and older is the same. We will select a sample of n=100 participants > 65 years of age, and we will use the mean of the sample as an estimate of the population mean. We want our estimate to be precise, specifically we want it to be within 3 units of the true mean LDL value. What is the probability that our estimate (i.e., the sample mean) will be within 3 units of the true mean? We think of this question as P(μ - 3 < sample mean < μ + 3).
Because this is a probability about a sample mean, we will use the Central Limit Theorem. With a sample of size n=100 we clearly satisfy the sample size criterion so we can use the Central Limit Theorem and the standard normal distribution table. The previous questions focused on specific values of the sample mean (e.g., 50 or 60) and we converted those to Z scores and used the standard normal distribution table to find the probabilities. Here the values of interest are μ - 3 and μ + 3. The solution can be set up as follows:
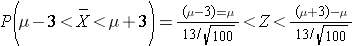
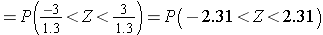
From the standard normal distribution table P(Z < 2.31) = 0.98956, and a P(Z < -2.31) = 0.01044. The range between these two = P(-2.31 < Z < 2.31) = 0.98956 - 0.01044 = 0.9791. Therefore, there is a 97.91% probability that the sample mean, based on a sample of size n=100, will be within 3 units of the true population mean. This is a very powerful statement, because it means that for this question looking only at 100 individuals aged 65 or older gives us a very precise estimate of the population mean.
Alpha fetoprotein (AFP) is a substance produced by a fetus that can be measured in pregnant woman to assess the probability of problems with fetal development. When measured at 15-20 weeks gestation, AFP is normally distributed with a mean of 58 and a standard deviation of 18. What is the probability that AFP exceeds 75 in a pregnant woman measured at 18 weeks gestation? In other words, what is P(X > 75)?
In a sample of 50 women, what is the probability that their mean AFP exceeds 75? In other words, what is P(X > 75)?
Notice that the first part of the question addresses the probability of observing a single woman with an AFP exceeding 75, whereas the second part of the question addresses the probability that the mean AFP in a sample of 50 women exceeds 75.