


Multiple Logistic Regression Analysis
Introduction to Logistic Regression Analysis
Logistic regression analysis is a popular and widely used analysis that is similar to linear regression analysis except that the outcome is dichotomous (e.g., success/failure, or yes/no, or died/lived).
The earlier discussion in this module provided a demonstration of how regression analysis can provide control of confounding for multiple factors simultaneously when evaluating continuously distributed outcome variables like body weight or BMI (i.e., outcomes that can be measured as an infinite number of values). However, some outcomes are dichotomous, i.e. they either occurred or they didn't. For example, the subjects either died or didn't; the subjects either developed obesity or they didn't. In these situations, it is desirable to utilize a similar approach to adjust for multiple possible confounding factors simultaneously, but multiple linear regression can't be used since the outcome is all or none. This situation is dealt with be utilizing an analogous method called multiple logistic regression.
Consider again the example looking at the association between diet score and BMI, but now let's make the outcome dichotomous by arbitrarily categorizing each BMI as either "high" or "low". Our goal now is to create a mathematical model that evaluates the likelihood of "high" BMI. We can begin by summarizing the results as shown below. For any given diet score, we compute the probability of having a high BMI as shown in the last column.
If we were to plot the probability of having a high BMI at any given diet score, it would look like the graph below, with a distinctive sigmoidal shape.
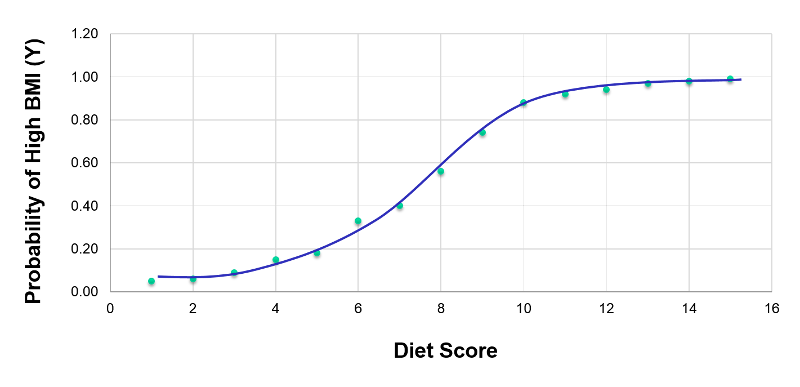
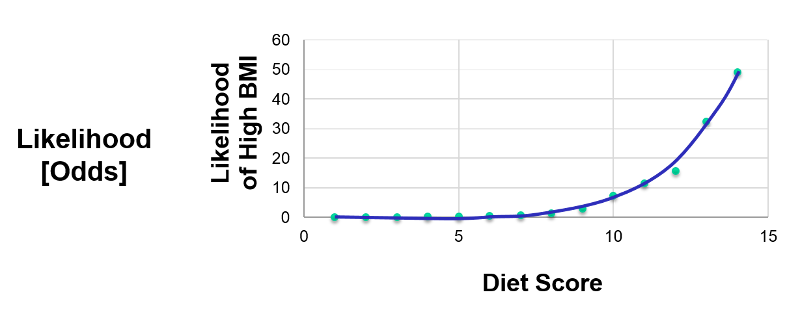
This transformation of the dependent variable into a probability is helpful in limiting the dependent variable to values between 0 and 1, but it isn't linear. Nevertheless, we can perform additional transformations. From the same data we could also plot the odds or the "likelihood" of having a high BMI at each diet score, where the likelihood (odds) = (probability of the outcome occurring) divided by (probability of the outcome not occurring). This is shown in the graph elow.
If we take the natural logarithm of the odds of a high BMI and plot this as a function of diet score, we get the linear graph below.
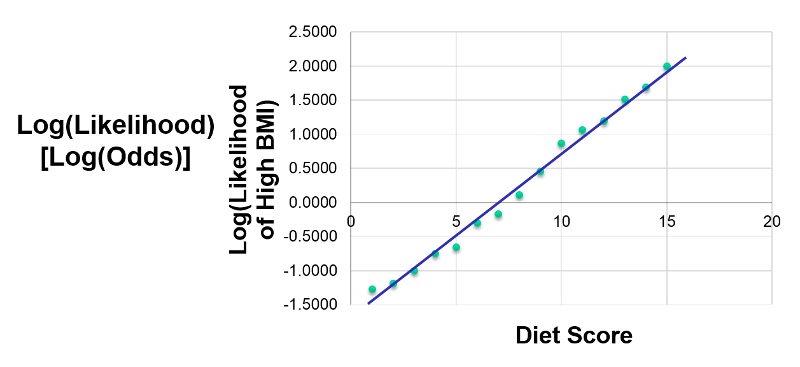
Since this is linear, we can treat this like a multiple linear; this is what logistic regression does. By taking the natural log, I have linearized this relationship, so now I can perform a regression analysis, just as I did for multiple linear regression. This makes it possible to examine how the log(odds of the outcome) is associated with multiple independent risk factors such as diet score, age group, and male gender. The model for evaluating these relationships could be summarized in the figure below.
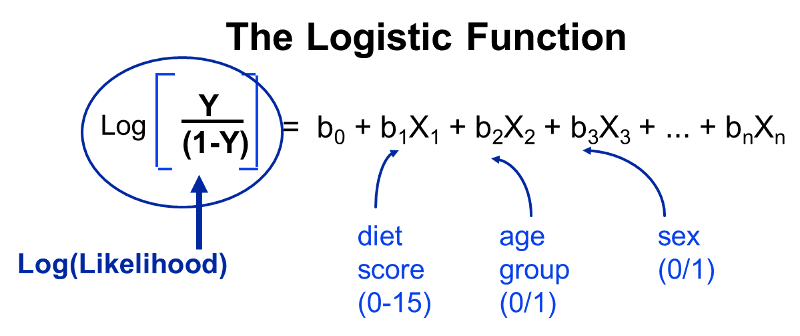
Note that the outcome (the dependent variable) is dichotomous - it either occurred or it didn't. In essence, we examine the odds of an outcome occurring (or not), and by using the natural log of the odds of the outcome as the dependent variable the relationships can be linearized and analyzed using methods analogous to those used in multiple linear regression analysis.
Note that the outcome (dependent variable) always dichotomous in logistic regression, but the independent variables (i.e., the predictor variables) may be either dichotomous or continuously distributed measurements (just as in multiple linear regression). Therefore, I could include the following independent variables:
- Diet Score (measurement from 0-15),
- ADULT (1 if age>20; 0 if younger)
- MALE (1 if male; 0 if female)