


A Nested Case-Control Study
Now consider a hypothetical prospective cohort study among 89,949 women in whom the investigators took blood samples and froze them at baseline for possible future use. After following the cohort for 12 years the investigators wanted to investigate a possible association between the pesticide DDT and breast cancer. Since they had frozen blood samples collected at baseline, they had the option of having the samples tested for DDT levels. If they had done this, the table below shows what they would have found.
| Br. Cancer |
No Br. Cancer |
Total Exposed |
|
|
DDT high |
360 |
13,276 |
13,636 |
|
DDT low |
1,079 |
75,234 |
76,313 |
|
Column Totals |
1,439 |
88,510 |
89,949 |
If they had had this data, they could have calculated the risk ratio:
RR = (360/13,636) / (1,079/76,313) = 1.87
However, the cost of analyzing each sample for DDT was $20, and to analyze all of them would have cost close to $1.8 million. So, like the previous study, the exposure data was very costly.
Although this was a prospective cohort study, we could regard the cohort as a source population and conduct a case-control study drawing samples from the cohort. We could, for example, analyze the blood samples on all of the women who had developed breast cancer during the 12 year follow up and on 2,878 randomly selected samples from the women without breast cancer (i.e., twice as many controls as cases). This would be described as a nested case-control study, i.e., nested within a cohort study.
The results might have looked like this:
| Br. Cancer |
No Br. Cancer |
Total Exposed |
|
|
DDT high |
360 |
432 |
Unknown |
|
DDT low |
1,079 |
2,446 |
Unknown |
|
Column Totals |
1,439 |
2,878 |
- |
Odds Ratio = (a/c) / (b/d) = (360/1,079) / (432/2,446)
= 1.89 during the 12 year follow up study
So, they could achieve an odds ratio that is very close to what the risk ratio would have been at a much lower cost: (1,439+2,878) x $20 = $86,340.
|
Key Concept: It is useful to think of all case-control studies as being nested, i.e., nested within a particular source populations.
|
Interpretation of the Odds Ratio
The odds ratio is a legitimate measure of association, and, when the outcome of interest is uncommon, it provides a good estimate of what the risk ratio would have been if a cohort study had been possible. When looking at increasingly common outcomes, the odds ratio gives estimates that are more extreme than the risk ratio, i.e., further away from the null value.
Not surprisingly, the interpretation of an odds is therefore similar to the interpretation of a risk ratio.
- The null value (no difference) is 1.0.
- Odds ratios > 1 suggest an increase in risk
- Odds ratios < 1 suggest a decrease in risk
The odds ratio above would be interpreted as follows:
"Women with high DDT blood levels at baseline had 1.89 times the odds of developing breast cancer compared to women with low blood levels of DDT during the 12 year observation period."
Test Yourself
 A case-control study examined the association between playing video games versus not playing video games, and development of high blood pressure among adolescents from 2012-2015. The data from the study is presented in the contingency table below.
|
|
Played Video Games |
Did Not Play Video Games |
Total |
| Cases |
57 |
33 |
90 |
| Controls |
108 |
162 |
270 |
Calculate the odds ratio for the association between playing video games and development of hypertension. Interpret the odds ratio you calculate in a sentence. See if you can do both of these correctly before looking at the answer.

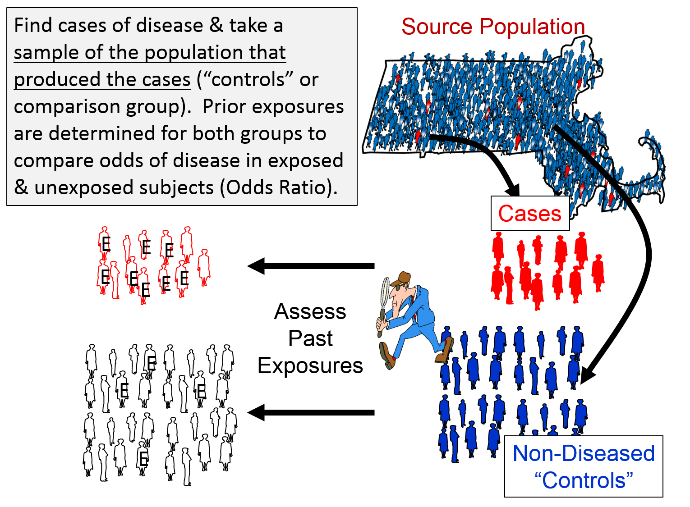
Recap of Case-Control Design
Case-Control Studies have the same goal as other analytic studies: to compare the incidence of disease in the exposed and unexposed groups, but the strategy is different, making them much more efficient for:
- rare outcomes
- dynamic populations
- when information on past exposures is difficult to get.
When conducting case-control studies, investigators begin by finding cases with the health outcome of interest and then find a sample of non-diseased controls who came from the same source population that produced the cases. The magnitude of association is expressed as the odds ratio, which is the odds of disease among the exposed subjects relative to the odds of disease among the non-exposed subjects.