EP717 Module 5 - Epidemiologic Study Designs – Part 2:
Case-Control Studies
Link to video transcript
Consider a hypothetical island population of 6,647 residents in which 13 people have been diagnosed with a rare neurological problem. Some of the residents think that the problem was caused by eating apples that had been sprayed with a particular pesticide used in one of the islands four orchards. We could ask all of the residents if they had eaten apples to assess their exposure, but assessing exposure in this way is complicated because all the grocery stores acquire apples from all four orchards, but the apples from all four orchards are McIntosh apples, and they all get mixed together. In addition, the neurological problem probably requires a certain threshold internal dose. A given individual's internal dose would depend on whether they ate apples, which orchard the apples came from, how many apples they ate, whether they had thoroughly washed the apples before eating them, whether the apples were peeled before consumption, the body weight of the individual, and their age. This makes it difficult to obtain the exposure information we need. An alternative is to take blood samples from all 6,647 residents and send them to a lab to have the pesticide concentration in their blood measured. However, it each sample would cost $50 to analyze making the total cost $332,350, and the health department can only spare about $4,000 on this investigation. With $4,000 we could take a random sample of 80 residents, but the disease is so rare that there would likely be few, if any, diseased people in our sample, and there might be few apple eaters among the 80 people we sampled. The problem here is two-fold; the disease is rare and it is difficult to get exposure data. A case-control design offers a possible way to circumvent these obstacles and test a hypothesis in this situation.
Essential Questions
After completing this section, you will be able to:
If we had had the money to analyze blood samples from all residents and examined them for evidence of the neurological problem when their blood was drawn, the results might have looked like this:
|
|
Diseased |
Non-diseased |
Total |
|
High pesticide levels |
7 |
1,000 |
1,007 |
|
Low pesticide levels |
6 |
5,634 |
5,640 |
Therefore, the incidence in the exposed individuals would be 7/1,007 = 0.70%, and the incidence in the non-exposed individuals would be 6/5,640 = 0.11%. Consequently, the risk ratio would be (7/1007) / (6/5640) = 6.53, suggesting that those exposed to the pesticide had 6.5 times the risk of getting the disease compared to those with low levels. This is a strong association.
To compute this risk ratio we used the number of diseased people in each group and the total number of people in each exposure group to compute the cumulative incidence in each group and then divided to get the risk ratio.
An alternative way of thinking about the same information is to think about the likelihood of exposure among the diseased cases (i.e., the odds of exposure in cases) compared to the likelihood of exposure in the overall source population. The odds of exposure in the case group were 7/6, while the odds of exposure in the overall source population were 1,007/5,640. Exposure was much more likely in the cases. In fact, the odds ratio was (7/6) / (1,007/5,640) = 1.1667/0.1785 = 6.53. This is just another method of computing the risk ratio, because this is just an algebraic rearrangement of the risk ratio.
This is demonstrated in the sequence of equations shown below.
But dividing by a fraction is equivalent to multiply by its reciprocal, so
Which rearranges to:

Which is the same as:
And multiplying by a fraction is equivalent to dividing by its reciprocal, so:

The point is that we can compute a risk ratio by computing the ratio
RR = CIe/CIu
... or by computing the exposure distribution in the diseased cases divided by the exposure distribution in the source population:
RR = (Odds of exposure in cases) / (Odds of exposure in overall source population)
In the next section you will see how case-control studies take advantage of this to maximize efficiency.
Ken Rothman, who is a world-renowned epidemiologist on our faculty, describes the case-control strategy as follows:
"Case-control studies are best understood by considering as the starting point a source population, which represents a hypothetical study population in which a cohort study might have been conducted. The source population is the population that gives rise to the cases included in the study. If a cohort study were undertaken, we would define the exposed and unexposed cohorts (or several cohorts) and from these populations obtain denominators for the incidence rates or risks that would be calculated for each cohort. We would then identify the number of cases occurring in each cohort and calculate the risk or incidence rate for each. In a case-control study the same cases are identified and classified as to whether they belong to the exposed or unexposed cohort. Instead of obtaining the denominators for the rates or risks, however, a control group is sampled from the entire source population that gives rise to the cases. Individuals in the control group are then classified into exposed and unexposed categories. The purpose of the control group is to determine the relative size of the exposed and unexposed components of the source population."
Kenneth Rothman - Epidemiology - An Introduction. Oxford University Press, 2002. p. 73
With this description in mind, let's re-examine the data from the island population with 13 cases of a rare neurological problem.
|
|
Diseased |
Non-diseased |
Total |
|
High pesticide levels |
7 |
1,000 |
1,007 |
|
Low pesticide levels |
6 |
5,634 |
5,640 |
We saw that the risk ratio can be computed by comparing the odds of exposure in the cases to the odds of exposure in the overall source population. The problem is that we do not have the resources to assess exposure in the entire population. However, note that, because this is an uncommon outcome, the exposure distribution in the "Non-diseased" column is very close to the exposure distribution in the "Total" source population. We saw previously that the odds of exposure in the total source population were 1007/5640 = 0.1785. The odds of exposure in the "Non-diseased" subjects are 1000/5634 = 0.1775. So, this provides a very reasonable estimate of the odds of exposure in the overall source population, or as Rothman says, the relative size of the exposed and unexposed componests of the source population. And, if all we need is an estimate of the relative size of the exposed and unexposed components of the source population, we can just take a sample of the non-diseased people and measure their pesticide levels to determine whether they were exposed or not.
We have $4,000 to spend on this, so let's measure pesticide levels in all 13 cases and a sample of 52 non-diseased "controls", i.e., four times as many controls as cases. Sampling non-diseased people to measure their pesticide levels will enable us to estimate the ratio of exposed to non-exposed people in the overall source population.
|
|
Diseased |
Non-diseased |
Total |
|
High pesticide levels |
7 |
8 |
unknown |
|
Low pesticide levels |
6 |
44 |
unknown |
|
Totals |
13 |
52 |
From these data we can estimate the risk ratio from the odds ratio, i.e.,
OR = (Odds of exposure in cases) / (Odds of exposure in non-diseased controls)
OR = (7/6) / (8/44) = 6.42
Notice that with this method we cannot compute the actual incidence of disease in the two exposure groups, because this sampling method does not give us the denominators for the total number of exposed and unexposed people. However, the odds ratio does provide a reasonable estimate of the risk ratio, particularly when the outcome is uncommon. For more common outcomes, the odds ratio overestimates (i.e., is more extreme than) the risk ratio.
Also note that since we cannot compute the incidence with a case-control design, we are also unable to compute the risk difference.
Nevertheless, the case-control design can provide valuable information when dealing with rare outcomes or when exposure data is difficult to obtain. The cost of this case-control study was $50 x 65 subjects = $3,250, so we were well under budget.
The odds ratio is the measure of association that can be estimated from case-control studies, and it is based on a comparison of the odds of exposure in cases and controls. However, modern epidemiologists view the case-control design as a more efficient version of a cohort study, and they interpret the results in a similar fashion.
|
|
Cases (Diseased) |
Controls |
|
High pesticide Levels |
7 |
8 |
|
Low pesticide levels |
6 |
44 |
|
Totals |
13 |
52 |
The odds ratio was computed as the odds of high pesticide exposure in cases compared to the odds of high pesticide exposure in controls.
OR= (7/6) / 8/44) = 6.42
However, algebraic rearrangement provides another way of computing and interpreting this, i.e., as the odds of disease among those with high pesticide levels compared to the odds of disease in those with low pesticide levels:
OR= (7/8) / (6/44) = 6.42
Therefore, we can interpret these finding in either of two ways:
The second method is preferred, so we would interpret the finding of the pesticide study as follows:
Residents of the island with high blood levels of pesticide had 6.42 times the odds of developing the neurological disease compared to residents with low levels of the pesticide during the period of this study.
As with cohort studies, there are two ways of orienting the contingency table summarizing the results of a case-control study as shown in the two tables below. First, with cases on row 1 and controls on row 2.
|
|
Exposed |
Unexposed |
|
Cases |
a |
b |
|
Controls |
c |
d |
Or, by rotating the table and putting the cases and controls in the columns.
|
|
Cases |
Controls |
|
Exposed |
a |
b |
|
Unexposed |
c |
d |
All three of these formulas for calculating the odds ratio give the same result. It is best to pick one of them and use it consistently.
Now consider a hypothetical prospective cohort study among 89,949 women in whom the investigators took blood samples and froze them at baseline for possible future use. After following the cohort for 12 years the investigators wanted to investigate a possible association between the pesticide DDT and breast cancer. Since they had frozen blood samples collected at baseline, they had the option of having the samples tested for DDT levels. If they had done this, the table below shows what they would have found.
| Br. Cancer |
No Br. Cancer |
Total Exposed |
|
|
DDT high |
360 |
13,276 |
13,636 |
|
DDT low |
1,079 |
75,234 |
76,313 |
|
Column Totals |
1,439 |
88,510 |
89,949 |
If they had had this data, they could have calculated the risk ratio:
RR = (360/13,636) / (1,079/76,313) = 1.87
However, the cost of analyzing each sample for DDT was $20, and to analyze all of them would have cost close to $1.8 million. So, like the previous study, the exposure data was very costly.
Although this was a prospective cohort study, we could regard the cohort as a source population and conduct a case-control study drawing samples from the cohort. We could, for example, analyze the blood samples on all of the women who had developed breast cancer during the 12 year follow up and on 2,878 randomly selected samples from the women without breast cancer (i.e., twice as many controls as cases). This would be described as a nested case-control study, i.e., nested within a cohort study.
The results might have looked like this:
| Br. Cancer |
No Br. Cancer |
Total Exposed |
|
|
DDT high |
360 |
432 |
Unknown |
|
DDT low |
1,079 |
2,446 |
Unknown |
|
Column Totals |
1,439 |
2,878 |
- |
Odds Ratio = (a/c) / (b/d) = (360/1,079) / (432/2,446)
= 1.89 during the 12 year follow up study
So, they could achieve an odds ratio that is very close to what the risk ratio would have been at a much lower cost: (1,439+2,878) x $20 = $86,340.
|
Key Concept: It is useful to think of all case-control studies as being nested, i.e., nested within a particular source populations.
|
The odds ratio is a legitimate measure of association, and, when the outcome of interest is uncommon, it provides a good estimate of what the risk ratio would have been if a cohort study had been possible. When looking at increasingly common outcomes, the odds ratio gives estimates that are more extreme than the risk ratio, i.e., further away from the null value.
Not surprisingly, the interpretation of an odds is therefore similar to the interpretation of a risk ratio.
The odds ratio above would be interpreted as follows:
"Women with high DDT blood levels at baseline had 1.89 times the odds of developing breast cancer compared to women with low blood levels of DDT during the 12 year observation period."
 A case-control study examined the association between playing video games versus not playing video games, and development of high blood pressure among adolescents from 2012-2015. The data from the study is presented in the contingency table below.
|
|
Played Video Games |
Did Not Play Video Games |
Total |
| Cases |
57 |
33 |
90 |
| Controls |
108 |
162 |
270 |
Calculate the odds ratio for the association between playing video games and development of hypertension. Interpret the odds ratio you calculate in a sentence. See if you can do both of these correctly before looking at the answer.
Answer
Case-Control Studies have the same goal as other analytic studies: to compare the incidence of disease in the exposed and unexposed groups, but the strategy is different, making them much more efficient for:
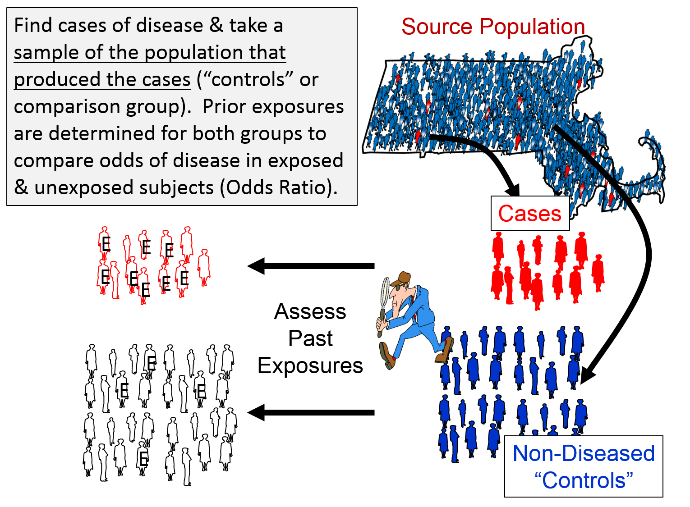
When conducting case-control studies, investigators begin by finding cases with the health outcome of interest and then find a sample of non-diseased controls who came from the same source population that produced the cases. The magnitude of association is expressed as the odds ratio, which is the odds of disease among the exposed subjects relative to the odds of disease among the non-exposed subjects.
Careful thought should be given to the case definition to be used. If the definition is too broad or vague, it is easier to capture people with the outcome of interest, but a loose case definition will also capture people who do not have the outcome of interest. On the other hand, an overly restrictive case definition will exclude potential cases, and the sample size may be limited. Investigators frequently wrestle with this problem during outbreak investigations. Initially, they will often use a somewhat broad definition in order to identify potential cases. However, as an outbreak investigation progresses, there is a tendency to narrow the case definition to make it more precise and specific, for example by requiring confirmation of the diagnosis by laboratory testing. In general, investigators conducting case-control studies should thoughtfully construct a definition that is as clear and specific as possible without being overly restrictive.
For example, if one were to conduct a case-control study on the association between smoking and heart disease and simply defined the cases as someone who smokes and controls as someone who doesn't smoke raises a lot of questions. Does one or two cigarettes a year make one a smoker? Should someone who used to smoke regularly, but quit be classified as a smoker, a non-smoker, or neither?
The CDC suggests the following definitions regarding classification of tobacco smoking:
Another classic example of the importance of a clear case definition is a case-control study trying to determine whether use of a particular drug by pregnant women increases the risk of birth defects in their offspring. Should the investigators define a case as a child with any congenital defect large or small? Different drugs and other exposures have different effects and may influence one organ system but not others. Using an all-encompassing case definition like any congenital defect might lead to an underestimate of an important association or even a failure to recognize the association at all.
Typical sources for cases include:
Selection of control subjects hinges on how the cases are selected. The purpose of the controls is to estimate the exposure distribution in the source population, i.e., to estimate the odds of exposure in the overall source population from which the cases came. It is important to remember that these controls are not the unexposed controls in a laboratory experiment. Some of the controls in a case-control study will have the exposure of interest, and what they provide is an estimate of how prevalent the exposure is in the overall source population.
Selection of an appropriate control group is one of the most difficult aspects of conducting a case-control study. There are two key principles that should be followed in selecting controls:
If either of these principles are not adhered to, selection bias can result. Selection bias will be discussed in detail in the module on bias.
Consider the hypothetical example in the figure below, which summarizes the exposure distribution in diseased and non-diseased people in a sources population and compares it to the exposure distributions in the samples of cases and controls that were selected for a study.
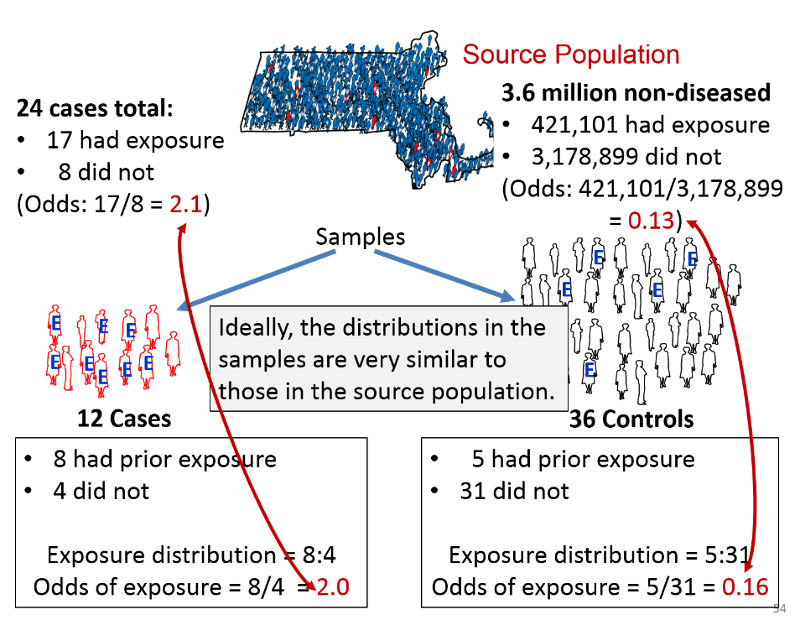
Suppose the investigators were dealing with a rare disease that was present in only 24 people in a source population with 3.6 million non-diseased people. Suppose also that the true exposure distribution in the 24 cases was 17:8, or 2.1 to 1, and the exposure distribution in the non-diseased people in the source population was 421,101:3,178,899, or 0.13 to 1. If so, the true odds ratio in the population would be 2.1/0.13 = 16.15.
Suppose further that the investigators could only identify 12 cases who were willing to participate in the study, and they selected three times as many control subjects. Among the 12 sampled cases the exposure distribution was 8:4, or 2 to 1, and among the 36 sampled controls, the exposure distribution was 5:31, or 0.16. If so, the estimated odds ratio from the samples would be 2.0/0.16 = 12.5. Despite the fact that this was a very small sample, the sampling methodology provided exposure distributions that were similar to those in the entire source population, and these provided an estimated odds ratio that was reasonably close to the true value in this population.
Investigators conducted a case-control study to determine whether having an induced abortion increases the risk of a subsequent spontaneous abortion (JAMA 243:2495-2499, 1980). Cases were women who entered Boston City Hospital from 1976-1978 with a spontaneous abortion <20 weeks gestation. Controls were women who delivered live-born infants at Boston City Hospital during the same time period. Both groups were asked whether they had had a prior induced abortion.
"We identified patients entering Boston City Hospital from July 1976 until February 1978 with a spontaneous abortion at less than 20 weeks' gestation or premature delivery between 20 to 27 weeks' gestation (the case group). We used obstetric patients whose dates of delivery coincided with the cases' dates of spontaneous loss as a comparison group."
Do the controls in this study fulfill the would criterion?
Answer
Investigators conducted a case-control study to measure the association between condom use and acute gonorrhea in men. Cases were male patients with acute gonorrhea seen at a local health clinic from June 1 through June 30. Controls were male patients diagnosed with a sexually transmitted disease other than gonorrhea during the same time period. Are the controls in this study selected independently from exposure?
Answer
There are three main sources of control subjects:
A population-based case-control study is one in which the cases come from a precisely defined population, such as a fixed geographic area, and the controls are sampled directly from the same population. In this situation cases might be identified from a state cancer registry, for example, and the comparison group would logically be selected at random from the same source population.
Population controls can be identified from voter registration lists, tax rolls, drivers license lists, and telephone directories or by "random digit dialing" (which has the advantage that it includes unlisted numbers). High response rates are important regardless of the method of invitation to participate, because non-response bias can be introduced if response rates are low and non-responders differ from responders. For example, non-responders of lower socioeconomic status might not respond if they are forced to work multiple low-paying jobs.
If cases are obtained from a medical facility, the controls should be obtained from the same facility provided they meet two criteria:
The advantages of using controls who are patients from the same facility are:
Occasionally investigators will ask cases to nominate controls who are in one of these three categories because they have similar characteristics, such as genotype, socioeconomic status, or environment, i.e., factors that can cause confounding but are hard to measure and adjust for. By matching cases and controls on these factors, confounding by these factors will be controlled.
In 1948 two British investigators conducted a case-control study to examine the association between smoking and lung cancer. Cases were patients who were being treated for lung cancer in 20 London hospitals. Controls were patients in the same hospitals who were being treated for non-cancer medical problems such as heart disease, pneumonia, emphysema, bronchitis. [Doll R, Hill AB: Smoking and carcinoma of the lung: preliminary report. British Medical Journal 1950;2:739-48.]
Is this an appropriate control group?
Answer
For rare outcomes the number of cases that can be unrolled may be limited, making it difficult to achieve a precise estimate of the odds ratio. Statistical power can be increased somewhat by enrolling more controls than cases. Investigators will sometimes enroll 2, 3, or even 4 times as many controls as cases to increase statistical power, but there is very little advantage in exceeding a 4:1 ratio of controls to cases. Selecting more than four controls for each case usually means a lot more work to collect the additional data without any meaningful increase in statistical power.
Case-control studies provide a method that avoids many of the limitations of cohort studies. Case-control studies are advantageous under the following circumstances:
|
Strengths of Case-Control Studies:
The temporal sequence between exposure and outcome is generally clear (but not always). There are fewer ethical concerns than in randomized clinical trials. They are less expensive and time-consuming than prospective cohort studies. They are more efficient for rare outcomes and diseases with long latency between exposure and development of the outcome. They are more efficient when exposure data is difficult or costly to obtain. They are good for studying dynamic populations in which follow up is difficult. They can evaluate effects of multiple exposures on single outcome.
|
|
Limitations of Case-Control Studies: They focus on a single outcome. They are Inefficient for rare exposures. Information on past exposures may be inaccurate, especially if obtained by recollection of the subjects. They are more susceptible to selection bias, recall bias, and interviewer bias (discussed in the module on Bias). Do not allow calculation of incidence, risk ratio, or risk difference.
|
As with cohort studies and clinical trials one of the first steps in the analysis of a case-control study is to generate simple descriptive statistics on each of the groups being compared, i.e., the case and the controls. This helps characterize the study population, and it also alerts you and your readers to any differences between the groups with respect to other exposures that might cause confounding.
After generating the descriptive statistics for a case-control study, the next step is to organize the data using contingency tables and to calculate estimates for the odds ratio. There may be confounding factors that distort the odds ratio, but one still begins by generating crude measures of association, i.e., estimates that have not yet been adjusted for confounding factors. In a later module you will learn how to use R to adjust for confounding in a case-control study.
Selection of a study design depends on the scientific questions being addressed and should take into account ethics and feasibility. For example, randomized clinical trials provide the best opportunity to identify small but potentially important clinical associations, but it would not be ethical to address all questions with a randomized clinical trial (e.g., whether maternal smoking during pregnancy is associated with a greater risk of having a premature or low birth weight infant). Observational studies (cohort studies and case-control studies) avoid many ethical problems, because potentially harmful exposures are not being allocated by the investigators, but they frequently present potential problems with regard to confounding and bias. Clinical trials and prospective cohort studies often require large numbers of subjects and long periods of follow-up that make them too costly to perform. Retrospective cohort studies and case-control studies are best to study outcomes with long latency periods, but getting accurate exposure data may be difficult. Case-control studies are particularly useful when studying rare outcomes, dynamic populations, and in situations in which exposure information is costly or difficult to obtain.