Toxicology
How can we estimate expected health effects from exposure data with limited human-health information?
For many chemicals or compounds we are unsure of the specific health effects, particularly with regard to new products whose health risks are unknown. Toxicology is the study of the adverse effects of chemicals or physical agents on living organisms, including their fate and transport in the body.
ATSDR (Agency for Toxic Substances and Disease Registry) is a US federal agency charged with a variety of functions related to health effects of hazardous substances. These include public health assessments of waste sites, health consultations concerning specific hazardous substances, health surveillance and registries, response to emergency releases of hazardous substances, applied research in support of public health assessments, information development and dissemination, and education and training concerning hazardous substances.
|
Optional Additional Resources
|
Dose-Response Assessment
How do we know what level dose is harmful?
The relationship between degree of exposure (dose) and magnitude of harmful health effects (toxicity) has generally been addressed by observing how varying doses of an agent influence the frequency or severity of outcomes. Certainly, it would be unethical to purposely expose humans to varying doses of potentially harmful chemicals in order to observe the effects. Consequently, these relationships have been explored most commonly in animals, and the results have been extrapolated to humans.
Animal Studies
The Draize test is an acute toxicity test that was introduced in 1944 by FDA toxicologists to test the effects of cosmetics. Measured amounts of the test substance are applied to the eye or the skin of a conscious, restrained rabbit and left there for a fixed amount of time. The substance is then rinsed out, and the animal is observed for up to fourteen days for signs of inflammation (redness, swelling, edema, tenderness) or more severe effects, such as discharge, ulceration, hemorrhage, cloudiness, or blindness. Not surprisingly, the test has been controversial and its use has declined, although it is still recognized by the FDA, since no test has been accepted as an adequate replacement. Anesthetics are now used more commonly, and substances that are known to be toxic are generally not used in Draize tests.
Many other test substances can be tested in animals by injecting it or having them ingest it or inhale it. Since the goal is to relate dosage to toxicity groups of animals would be allocated to receive drugs according to a fixed schedule (e.g., daily) with each group receiving a different dose. The animals would be observed for frequency or severity of clinical outcomes. Acute toxicity tests in the past frequently used death as the definitive outcome. The dose that was lethal in 50% of a group of animals (the LD50) was a standard measurement that enabled one to address relative toxicity.
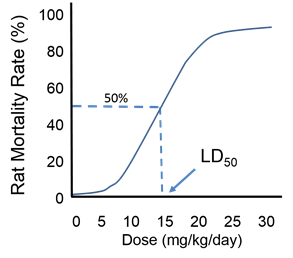
Note that the same concept can be applied to effective doses of drugs. For example, if we were considering the dose of an analgesic that was effective for relieving moderately severe pain from osteoarthritis of the knee, we might consider the effective doses indicated in the table below.
| ED0 |
Dosage that relieves 0% of treated subjects |
| ED10 |
Dosage that relieves 10% of treated subjects |
| ED50 |
Dosage that relieves 50% of treated subjects |
| ED90 |
Dosage that relieves 90% of treated subjects |
It is now more common to observe for non-lethal effects, such as the frequency or severity of tumors, weight loss, behavioral changes, or other abnormalities. Another option is to euthanize animals at fixed intervals of time to examine tissues and body fluids for abnormalities
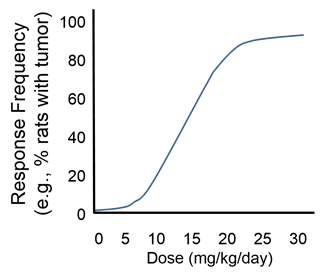
Still other procedures look for toxic effects of agents using cells grown in culture (in vitro tests rather than in vivo).
The purpose of these tests is to:
- Gain information about toxicity that can potentially be extrapolated to humans.
- Estimate the doses at which effects occur through dose-response curves
- Identify subtle but potentially important effects by examining tissues and fluids
- Explore the biological mechanisms by which adverse effects occur
- Establish regulatory limits for various exposures including emissions
Threshold Dose
Dose-response curves are frequently sigmoidal, or S-shaped, and for many substances small doses do not appear to be toxic. The point at which toxicity first appears is known as the threshold dose, and the risk of an adverse outcome increases as the dose increases further. This concept is further refined by the terms NOAEL (meaning "no observed adverse effect level") and LOAEL (meaning "lowest observed adverse effect level"). In the example below, a dose of 15 mg/kg/day would represent the threshold dose, which is the LOAEL.
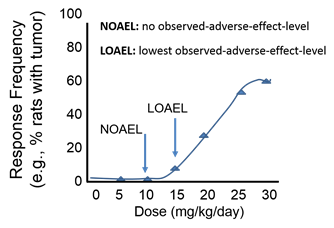
For most non-cancer health outcomes, we assume there is a level dose below which there is no negative health effect. However, carcinogens are generally considered to have no threshold, i.e., no safe dose
|
Advantages and Disadvantages to Animal Studies Advantages
Disadvantages
|
Observational Studies in Humans
While it would be unethical to allocate humans to receive a potentially harmful substance, it is possible to glean dose-response information from humans in observational studies, i.e., those in which subjects select their own exposures and doses. For example, we have abundant data regarding the effects of alcohol ingestion in humans, as shown in the table below.
|
% Alcohol in Blood |
Observed Effect |
|---|---|
|
0 |
None |
|
0.05-0.1 |
Stimulant; social relaxation |
|
0.1-0.3 |
Increasing lack of coordination |
|
0.3-0.4 |
Loss of consciousness |
|
0.4+ |
Possibly lethal |
Occupational Health Epidemiology
Occupational health epidemiology is the study of workplace exposures and associated health effects. Animal studies can provide extremely useful information, but we have already noted some of the limitation, particularly with respect to the tendency to use very high dose for short periods of observation and the issue of extrapolating findings in rodents to humans. However, studies in humans can provide additional information about the toxic effects of chemicals, including chemical exposures in the workplace, exposures in the environment, studies evaluating the safety and efficacy of drugs.
Test Yourself
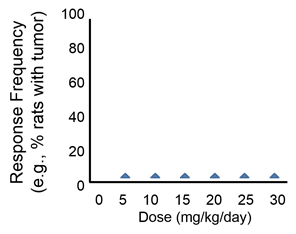
 Question: How would you assess the potential toxicity of the drug shown in the dose-response curve below?
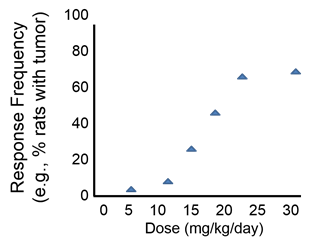
 Question: How would you interpret the next dose-response curve?
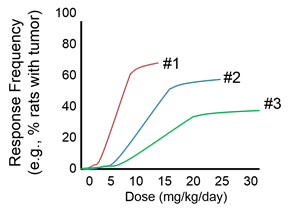
 Question: How would you assess the dose-response relationships shown in the graph below?
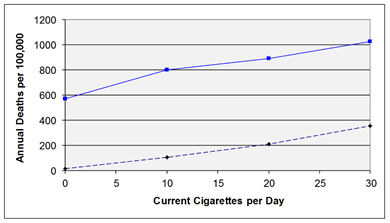
 Question: Consider the information in the graph below, which was constructed based on data from the British Doctors Cohort
 .
.
They reported the annual mortality for a variety of disease at four levels of cigarette smoking per day: Never smoked, 1-14/day, 15-24/day, and 25+/day. In order to perform a correlation analysis, we rounded the exposure levels to 0, 10, 20, and 30 respectively, so it is just an approximation, but probably reasonable. The upper curve shows how the incidence of death from cardiovascular disease changes with increased levels of cigarette smoking. The lower curve shows the mortality rate from lung cancer.
How would you asses these dose-response data in humans? Think about how you would interpret this information before you look at the answer.
