Methods for Collecting Data on Exposure
The dose of an environmental exposure depends on the amount of contaminant in the media (air, food, etc.), and the level of human contact with that media, i.e., how much was inhaled, ingested, or adsorbed or absorbed by the skin. These are components of the conceptual model used by environmental health scientists.
|
Four Basic Methods for Obtaining Data on Exposure: 1. Self-reporting 2. Monitoring the environment around an individual or in a geographic area 3. Measuring biomarkers: Measure markers of exposure in the individual's body 4. Modeling techniques
|
1. Self-reporting
Self-reported information on exposures can be collected using questionnaires and interviews asking about behaviors, ambient environment, purchasing, diet (e.g., a food frequency questionnaire), medical history, etc. Self-reporting is most useful for personal habits and medications used, and some exposures can only be assessed with self-reports (e.g., sexual practices and recreational drug use). Self-reporting has clear limitations in that people may not accurately remember past exposures, or they may have difficulty quantifying them accurately (e.g., "How much did you exercise?").
In addition, environmental exposures to contaminants in air or water cannot be accurately quantified by self-report and often require a formal exposure assessment to estimate human contact with contaminants.
2. Monitoring the Environment
There are many devices that provide a means of monitoring exposures to particulate matter in the air and to volatile organic compounds such as benzene. The Clean Air Act requires the US EPA to set standards for air quality and to monitor air quality throughout the United States.
Monitors are available to be used in several levels.
• Sampling in a Community or Region
Air Sampling of Particulate Matter: There are several methods available for actively sampling particulate matter. Size-selective sampling is the collection of one particle size fraction, such as the collection of PM10 or PM2.5, i.e. particles in the air measuring less than 10 microns or less than 2.5 microns..
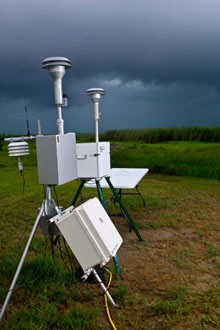
Image source: https://archive.epa.gov/emergency/bpspill/web/html/air-mon.html
Active Sampling of Gases and Vapors: A sampling pump is required to actively sample gases and vapors. One method involves the use of sorbent tubes, which contain collection materials such as activated charcoal, silica gel, tenex, etc.
Passive Sampling of Gases/Vapors: Passive sampling does not require a pump. Passive samplers have been developed for many gaseous pollutants, such as NO2, O3, and volatile organic compounds (VOCs). The sampling rate is controlled by a physical process, such as diffusion through a static air layer or permeation through a membrane.
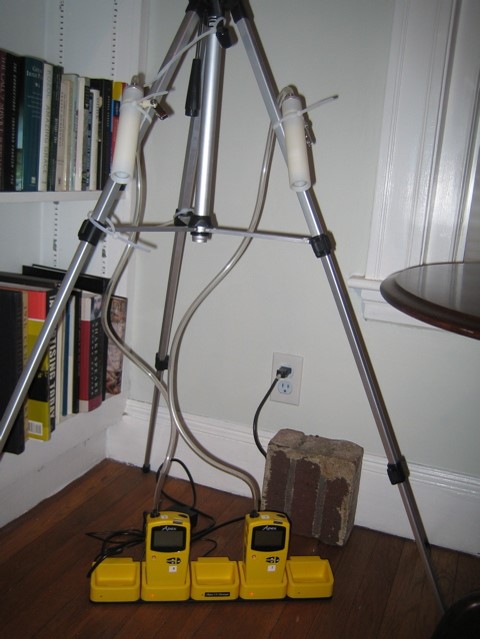
• Air Sampling in a Microenvironment
e.g., in a home or workplace
• Personal Biomonitoring
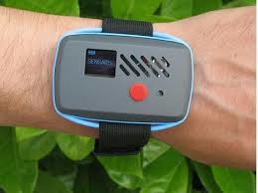
Measuring exposure in a specific individual using a portable or personal sampling device attached to the individual or placed where the individual spends time.

|
Advantages and Disadvantages of Monitoring Advantages: Community, home, workplace, and personal monitoring is objective, quantitative, and usually continuous. Disadvantages: It is expensive and time consuming, and community biomonitoring may not accurately capture exposure level for every subject. In addition, personal biomonitoring is not feasible for large numbers of people.
|
3. Biomarkers
Biomarkers are biochemical, physiological, and histological changes that can be used to estimate either exposure to chemicals or the effects of exposure to chemicals. Some examples of biomarker samples include blood, urine, hair, and fatty tissue. Because of the invasive nature of biomarker collection, it is often difficult to use them for exposure assessment. Ideally, measurement of a biomarker might provide information about internal dosage of potentially harmful substances.
Non-invasive sampling utilizes breath tests, urine samples, nasal swabs, buccal swabs, sputum, breast milk, semen, hair, nail clippings, or fecal samples.
Invasive sampling refers to blood tests or tissue biopsies.
Biomarkers provide a means of estimating the internal dose of a contaminant that is specific for a single person. Examples of biomarkers include:
- Blood lead concentration
- Blood alcohol concentration
- PBDE (PBDE is polybrominated diphenyl ethers, compounds used as flame retardants)
- Cortisol in hair
- MRSA (methicillin-resistant Staphylococcus aureus) in a nasal swab
- Serum antibodies to influenza viruses
- Serum antibodies to hepatitis A virus
|
Advantages and Disadvantages to Biomarkers
Advantages: They are objective, quantitative, and provide an accurate measure of an individual's internal dose. Biomarkers can be collected and monitored across the population to gain insight into trends and subgroups at risk. Disadvantages: They can be expensive, and measurements at a particular point in time may not accurately reflect exposure over a broad period of time.
|
Examples:
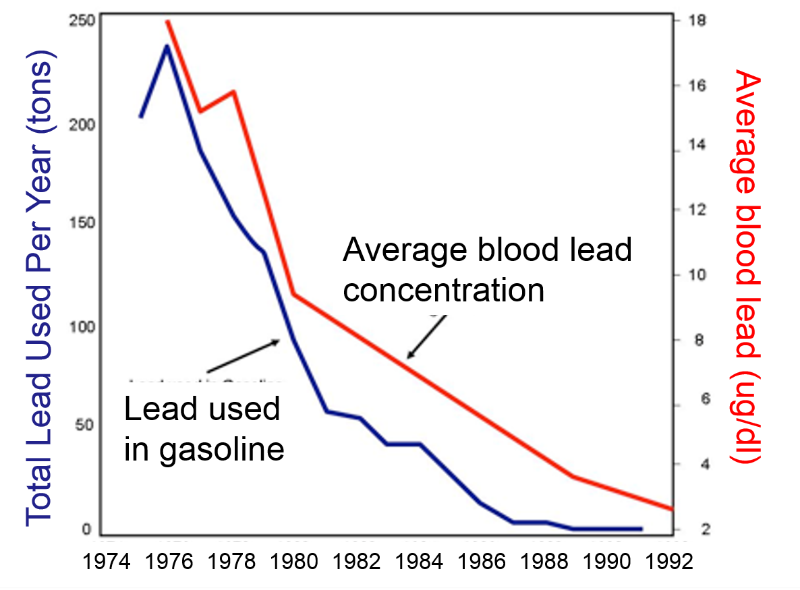
The image below shows that average blood levels of lead in the US population (red line) fell dramatically in parallel with reductions in the amount of lead used as an additive to gasoline (blue line).
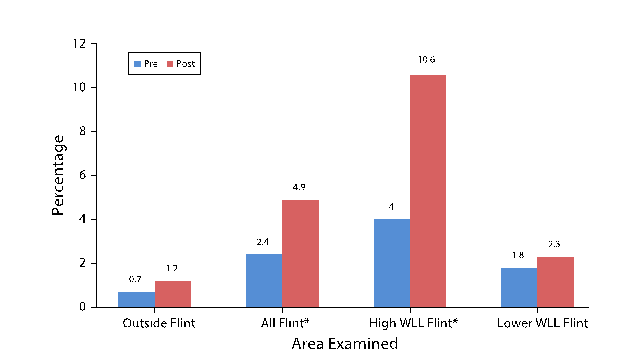
The graph below shows that the percentage of people with high blood levels in Flint, Michigan increased substantially after their water source changed from Lake Huron to the Flint River.
Community, area and personal biomonitoring are all potentially useful in specific circumstances. Personalized assessments of exposure can be particularly useful by providing investigators with individual exposure data. However, personal biomonitoring is expensive and limits the number of people for whom data is available.
4. Modeling
Mathematical modeling is a fourth method of obtaining exposure data, and it is attractive because the other methods can be difficult, time-consuming, and expensive. However, modeling doesn't provide real measurements; it provides estimates based on a mathematical model which might be in error or might be based on assumptions that don't apply to many of the individuals.
Types of models that have been employed for exposure assessment include:
- Groundwater models: quantifying movement of subsurface water
- Surface water models: modeling contaminant movement and concentration in lakes, streams, etc.
- Food chain models: track movement of contaminants thru food chains and estimate impacts
- Multimedia models: quantifying impacts of contaminants moving through more than one environment
For example, the Cape Cod Breast Cancer and Environment Study used geographic information system mapping technology (GIS) to assess exposures to pesticides used in cranberry bogs or in areas sprayed for tree pests and also assessed exposure to drinking water contaminated by wastewater or affected by residential, commercial, or industrial land use. GIS was used to calculate distance from each household to these exposures.
Modeling has been particularly useful for assessing the fate and transport of contaminants, i.e., where they are likely to go.
Fate refers to the chemical and physical degradation and transformation of contaminants and their final destination in the environment. Degradation is the breakdown of contaminants, while transformation refers to an alteration in its structure that may render it more or less harmful. Biodegradation is breakdown by microbes. Degradation or transformation can also occur through chemical or physical processes such as oxidation, hydrolysis, or photolysis. in the environment. Oxidation is breakdown that involves loss of electrons, often as a result of reaction with oxygen. Hydrolysis is the splitting of a molecule through a reaction with water. Photolysis is breakdown caused by absorption of light energy. These processes can be influenced by local conditions such as temperature, presence of water or precipitation, abundance of sunlight, and even the presence of other contaminants. Some chemicals are highly resistant to degradation and transformation and tend to persist or accumulate in the environment, such as DDT and polychlorinated biphenyls (PCBs) .
.
Transport refers to the movement of contaminants within or between environmental media (water, air, food and soil). Contaminants can be transported for short or long distances. For example:
- Volatile organic compounds (VOCs) are carbon-based compounds containing that have a low boiling point, which means that they evaporate readily (volatilize) and transform from a liquid phase into gases that enter the atmosphere. For example benzene can evaporate and move through the atmosphere and then re-enter environmental media through fallout from precipitation or particulate matter.
- Precipitation can promote leeching of contaminants from surface soil to greater depths and contaminate ground water.
- Pollutants that adsorb to soil can be transported via soil erosion or may be taken up by plants. For example, pesticides taken up by pests or crops can be degraded or transformed or accumulate. Some of the pesticides used in agriculture will be removed with crops when they are harvested.
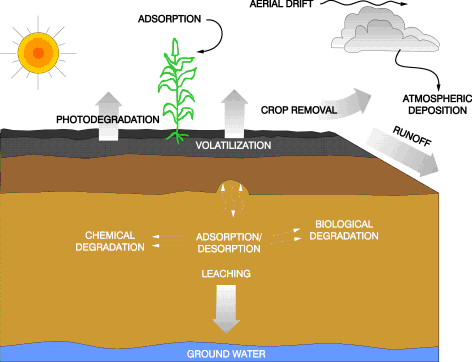
Image source: Source: http://www1.agric.gov.ab.ca/$department/deptdocs.nsf/all/wat3350
Leukemia in Woburn, MA
Between 1969 and 1986 twenty-one Woburn children were diagnosed with leukemia, and twelve died. Two of the wells supplying drinking water to parts of Woburn were found to be heavily contaminated with trichloroethylene (TCE) , an industrial solvent used to dissolve grease and oil. The wells also contained tetrachloroethylene (PCE)
 , also known as perc, Both of these industrial solvents were dumped into the soil by local industry. The solvents were transported by rainwater into the Aberjona River and groundwater aquifers that underlie the city. Eventually the solvents reached wells "G" and "H" that provided drinking water for many Woburn residents. The short video animation below summarizes the movement of the contaminants in groundwater based on the model that was developed.
Animation created by Scott Blair, Ohio State University, Department of Geological Sciences
To learn more about the investigation of the leukemia cluster in Woburn see our online case study at http://sphweb.bumc.bu.edu/otlt/MPH-Modules/woburnleukemia/index.html.


