Positive and Negative Predictive Value
When evaluating the feasibility or the success of a screening program, one should also consider the positive and negative predictive values. These are also computed from the same 2 x 2 contingency table, but the perspective is entirely different.
- Positive predictive value is the probability that subjects with a positive screening test truly have the disease.
- Negative predictive value is the probability that subjects with a negative screening test truly don't have the disease.

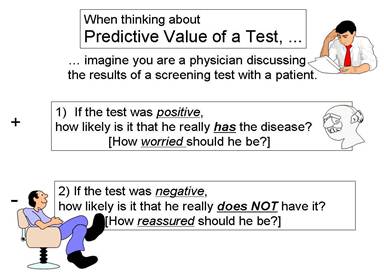
One way to avoid confusing this with sensitivity and specificity is to imagine that you are a patient and you have just received the results of your screening test (or imagine you are the physician telling a patient about their screening test results. If the test was positive, the patient will want to know the probability that they really have the disease, i.e., how worried should they be?
Conversely, if it is good news, and the screening test was negative, how reassured should the patient be? What is the probability that they are disease free?
Another way that helps me keep this straight is to always orient my contingency table with the gold standard at the top and the true disease status listed in the columns. The illustrations used earlier for sensitivity and specificity emphasized a focus on the numbers in the left column for sensitivity and the right column for specificity. If this orientation is used consistently, the focus for predictive value is on what is going on within each row in the 2 x 2 table, as you will see below.
Positive Predictive Value
If a test subject has an abnormal screening test (i.e., it's positive), what is the probability that the subject really has the disease? In the example we have been using there were 1,115 subjects whose screening test was positive, but only 132 of these actually had the disease, according to the gold standard diagnosis. Therefore, if a subject's screening test was positive, the probability of disease was 132/1,115 = 11.8%.
Table - Illustration of Positive Predicative Value of a Hypothetical Screening Test
|
|
Diseased |
Not Diseased |
Total |
|---|---|---|---|
|
Test Positive |
132 |
983 |
1,115 |
|
Test Negative |
45 |
63,650 |
63,695 |
|
Column Totals |
177 |
64,633 |
64,810 |
Here, the positive predictive value is 132/1,115 = 0.118, or 11.8%.
Interpretation: Among those who had a positive screening test, the probability of disease was 11.8%.
Negative Predictive Value
Negative predictive value: If a test subject has a negative screening test, what is the probability that the subject really does not have the disease? In the same example, there were 63,895 subjects whose screening test was negative, and 63,650 of these were, in fact, free of disease. Consequently, the negative predictive value of the test was 63,650/63,695 = 99.9%.
Table - Illustration of Negative Predicative Value of a Hypothetical Screening Test
|
|
Diseased |
Not Diseased |
Total |
|---|---|---|---|
|
Test Positive |
132 |
983 |
1,115 |
|
Test Negative |
45 |
63,650 |
63,695 |
|
Column Totals |
177 |
64,633 |
64,810 |
Here, the négative predictive values is 63,650/63,950=0.999, or 99.9%.
Interpretation: Among those who had a negative screening test, the probability of being disease-free was 99.9%.
Screening Validity Calculator
This widget will compute sensitivity, specificity, and positive and negative predictive value for you. Just enter the results of a screening evaluation into the turquoise cells.
Optional
Dr. David Felson is a Professor of Medicine in the Boston University School of Medicine, and he teaches a course in Clinical Epidemiology at the BU School of Public Health. In the video below, he discusses predictive value.


