


The Limitations of p-Values
Aschengrau and Seage note that hypothesis testing was developed to facilitate decision making in agricultural experiments, and subsequently became used in the biomedical literature as a means of imposing standards for decision making. P-values have become ubiquitous, but epidemiologists have become increasingly aware of the limitations and abuses of p-values, and while evidence-based decision making is important in public health and in medicine, decisions are rarely made based on the finding of a single study.
- Whether intentional or not, there is a tendency for p-values to devolve into a conclusion of "significant" or "not significant" based on whether the p-value is less than or equal to 0.05. This can be very misleading.
- P-values depend upon both the magnitude of association and the precision of the estimate (the sample size). If the magnitude of effect is small and clinically unimportant, the p-value can be "significant" if the sample size is large. Conversely, an effect can be large, but fail to meet the p<0.05 criterion if the sample size is small.
- There is a temptation to embark on "fishing expeditions" in which investigators test many possible associations. When many possible associations are examined using a criterion of p< 0.05, the probability of finding at least one that meets the critical point increases in proportion to the number of associations that are tested.
- Many investigators inappropriately believe that the p-value represents the probability that the null hypothesis is true. However, p-values are computed based on the assumption that the null hypothesis is true. The p-value is the probability that the data could deviate from the null hypothesis as much as they did or more. Consequently, the p-value measures the compatibility of the data with the null hypothesis, not the probability that the null hypothesis is correct.
- Statistical significance does not take into account the evaluation of bias and confounding.


Table 12-2 in the textbook by Aschengrau and Seage provides a nice illustration of some of the limitations of p-values.
|
Results of Five Hypothetical Studies on the Risk of Breast Cancer After Childhood Exposure to Tobacco Smoke (Adapted from Table 12-2 in Aschengrau and Seage) |
||||
|---|---|---|---|---|
|
Study |
# Subjects |
Relative Risk |
p value |
"Statistically Significant" |
|
A |
2500 |
1.4 |
0.02 |
Yes |
|
B |
500 |
1.7 |
0.10 |
No |
|
C |
2000 |
1.6 |
0.04 |
Yes |
|
D |
250 |
1.8 |
0.30 |
No |
|
E |
1000 |
1.6 |
0.06 |
No |
The authors start from the assumption that these five hypothetical studies constitute the entire available literature on this subject and that all are free from bias and confounding. The authors point out that the relative risks collectively and consistently suggest a modest increase risk, yet the p-values are inconsistent in that two have "statistically significant" results, but three do not. In this example, the measure of association gives the most accurate picture of the most likely relationship. The p-value is more a measure of the "stability" of the results, and in this case, in which the magnitude of association is similar among the studies, the larger studies provide greater stability.
Video: Just For Fun: What the p-value?
![]()
![]()
The p-Value Function
NOTE: This section is optional; you will not be tested on this
Rather than just testing the null hypothesis and using p<0.05 as a rigid criterion for statistically significance, one could potentially calculate p-values for a range of other hypotheses. In essence, the figure at the right does this for the results of the study looking at the association between incidental appendectomy and risk of post-operative wound infections. This study enrolled 210 subjects and found a risk ratio of 4.2. The chi-square test gave a p-value of 0.13, and Fisher's Exact Test gave a p-value of 0.26, which are "not statistically significant." However, to many people this implies no relationship between exposure and outcome.
The graph below gives a more complete summary of the statistical relationship between exposure and outcome. The peak of the curve shows the RR=4.2 (the point estimate). In a sense this point at the peak is testing the null hypothesis that the RR=4.2, and the observed data have a point estimate of 4.2, so the data are VERY compatible with this null hypothesis, and the p-value is 1.0. As you move along the horizontal axis, the curve summarizes the statistical relationship between exposure and outcome for an infinite number of hypotheses.
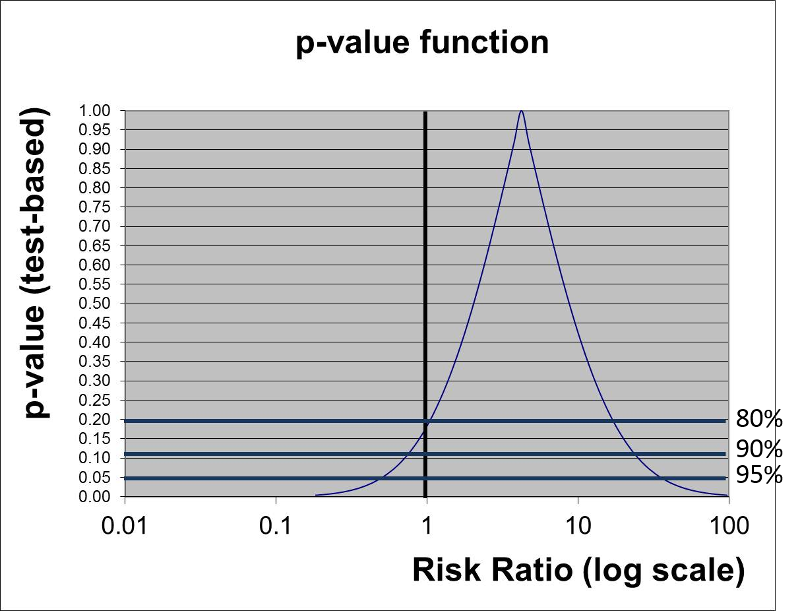
The three horizontal blue lines labeled 80%, 90%, and 95% each intersect the curve at two points which indicate the arbitrary 80, 90, and 95% confidence limits of the point estimate. If we consider the null hypothesis that RR=1 and focus on the horizontal line indicating 95% confidence (i.e., a p-value= 0.05), we can see that the null value is contained within the confidence interval. Note also that the curve intersects the vertical line for the null hypothesis RR=1 at a p-value of about 0.13 (which was the p-value obtained from the chi-square test).
However, if we focus on the horizontal line labeled 80%, we can see that the null value is outside the curve at this point. In other words, we are 80% confident that the true risk ratio is in the range of RR from 1 to about 25.
We noted above that p-values depend upon both the magnitude of association and the precision of the estimate (based on the sample size), but the p-value by itself doesn't convey a sense of these components individually; to do this you need both the point estimate and the spread of the confidence interval. The p-value function above does an elegant job of summarizing the statistical relationship between exposure and outcome, but it isn't necessary to do this to give a clear picture of the relationship. Reporting a 90 or 95% confidence interval is probably the best way to summarize the data.
