

Requesting Effect Measures
proc freq data=one order=formatted;
tables arm*anyv34 / measures;
run;
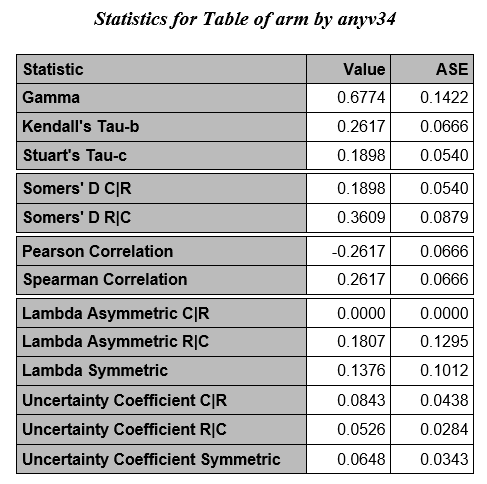
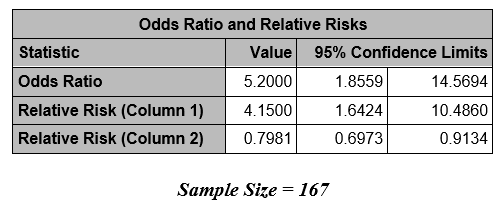
The above measures can be ignored for now; we will focus on the following measures, the odds ratio and the relative risk (column 1) which considers column 1 to contain the event of interest.
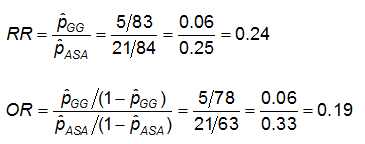
Recall that we obtained the following effect measures, comparing those on GG to those on ASA alone:
Estimated effect measures (GG vs. ASA):
Note that the RR produced by proc freq is RR = 4.15 - because they are comparing ASA to GG! The comparison is always the first row as compared to the second row. Here, ASA is in row 1 since ASA is formatted "0-Aspirin" and GG is formatted "1-Gamma Globulin". Similarly, the OR is the ratio of the odds of CA abnormalities in the ASA arm compared to the GG arm, instead of GG compared to ASA.
|
SAS calculates the odds ratio assuming that column 1 is the event of interest and row 1 is the treatment group of interest (meaning that column 2 is the reference event and row 2 is the reference treatment group). It calculates the relative risks also assuming row 2 is the reference group. It is preferable to arrange the data to make the outcome of interest appear in the first column and the target group to appear in the first row and to use formatting if it is not. If the data are not in this format, the odds ratio and relative risks are computed but the interpretation may be different than what is intended. |

We should re-format to ensure that we are comparing the new treatment, GG, to the usual treatment, ASA.
proc format;
value $armf "ASA"="2-Aspirin" "GG"="1-Gamma Globulin";
value eventf 0='No event' 1='Event';
run;
proc freq data=two order=formatted;
tables arm*anyv34 / measures;
run;
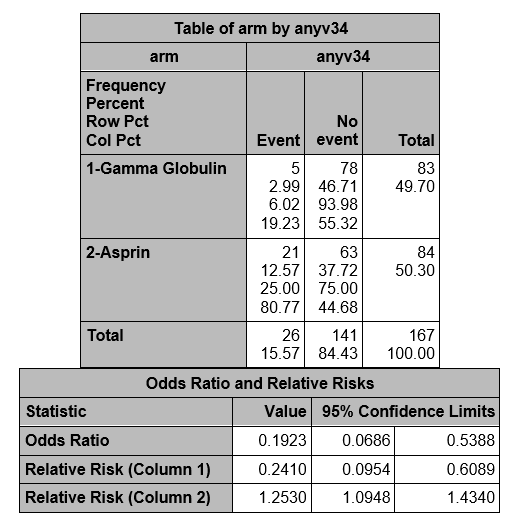
Now the measures compare GG to ASA, and we see the same measures we obtained by hand.
Table options can be combined in the TABLE statement; the following statement would provide observed and expected frequencies, row percentages, effect measures and the chi square
proc freq data=two order=formatted;
tables arm*anyv34 / chisq expected measures nocol nopercent;
run;