


The Chi-square Test of Independence
Table – Observed Disclosure Frequency Among Subjects Posing Three Types of Transmission Risk
| Transmission Risk | Disclosed | No Disclosure | Total |
| IV Drug Use Homosexual contact Heterosexual contact |
35 (67%) 13 (52%) 29 (58%) |
17 12 21 |
52 25 50 |
| Total | 77 (60.6%) | 50 | 127 |
- The null hypothesis (H0:) is that there is no association between HIV transmission risk group and disclosure, i.e., the frequency of disclosure does not differ across HIV transmission risk groups.
- The alternative hypothesis (HA:) is that there is an association between HIV transmission risk group and frequency of disclosure, i.e., that the frequency of disclosure differs across HIV transmission risk groups.
Note that the overall disclosure frequency was 77/127 = 60.6%, so the null hypothesis would predict that the disclosure frequency would be 60.6% for all three transmission modes. This was not the case; the frequency of disclosure varied from 52% to 67%. How different are these frequencies from what we would have expected under the null hypothesis (H0:)? Could the variability have resulted from sampling error?
The chi-square test helps answer this question by calculating a test statistic (x2) based on the differences between the frequencies observed in each cell compared to the frequencies expected under the null hypothesis. The chi-square equation is:

where "O" is the observed count for each exposure-outcome category, "E" is the expected count for each exposure-outcome category based on the null hypothesis, and the degrees of freedom (df) = (r-1) x (c-1), i.e., the number of rows (exposure categories) minus one times the number of columns (outcome categories) minus one in the contingency table.
If you are doing this manually, the next task is to compute the frequencies that would have been expected under the null hypothesis. If the overall frequency of disclosure was 60.6%, then H0: would predict 60.6% exposure in all three risk categories. We can therefore compute the expected number for each category by multiplying 0.606 times the number of subjects in each exposure category. For example, for IV drug users the expected number of disclosures is 0.606 x 52 = 31.5. (It doesn't matter if these aren't whole numbers.) We can similarly multiply 0.606 times the number of subjects in the other two exposure categories as shown in the table below. The number of non-disclosures in each category is simply the category total minus the number of expected disclosures, so for the IV drug users the number of expected non-disclosures is 52 - 31.5 = 20.5.
Table – Expected Disclosure Frequency (under H0:) Among Subjects Posing Three Types of Transmission Risk
| Transmission Risk | Disclosed | No Disclosure | Total |
| IV Drug Use Homosexual contact Heterosexual contact |
31.5 (60.6%) 15.2 (60.6%) 30.3 (60.6%) |
20.5 9.8 19.7 |
52 25 50 |
| Total | 77 (60.6%) | 50 | 127 |
Next, we calculate x2:

degrees of freedom = df = (r-1)*(c-1) = (3-1)*(2-1) = 2
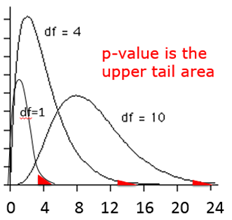
As with the t-distribution, the χ2 distribution is actually a series of distributions, i.e., one for each number of degrees of freedom, and the upper tail area is the probability, i.e., the p-value. Even though it evaluates the upper tail area, the chi-square test is regarded as a two-tailed test (non-directional), since it is basically just asking if the frequencies differ.
The table below shows a portion of a table of probabilities for the chi-square distribution.
|
Alpha Level |
|||||
| df | 0.10 | 0.05 | 0.025 | 0.01 | 0.005 |
| 1 | 2.71 | 3.84 | 5.02 | 6.63 | 7.88 |
| 2 | 4.61 | 5.99 | 7.38 | 9.21 | 10.60 |
| 3 | 6.25 | 7.81 | 9.35 | 11.34 | 12.84 |
| 4 | 7.78 | 9.49 | 11.14 | 13.28 | 14.86 |
| 5 | 9.24 | 11.07 | 12.83 | 15.09 | 16.75 |
| 6 | 10.64 | 12.59 | 14.45 | 16.81 | 18.55 |
| 7 | 12.02 | 14.07 | 16.01 | 18.48 | 20.28 |
| 8 | 13.36 | 15.51 | 17.53 | 20.09 | 21.95 |
| 9 | 14.68 | 16.92 | 19.02 | 21.67 | 23.59 |
| 10 | 15.99 | 18.31 | 20.48 | 23.21 | 25.19 |
This comparison has 2 degrees of freedom, so we read across the appropriate row in the table and find that a χ2=1.95 with 2 degrees of freedom isn't even on the table. However, the p-value must be greater than 0.10, since 1.95 is clearly less than the critical value of 4.61 for an alpha level (p-value) of 0.01 with 2 degrees of freedom. Based on this we could conclude that the observed differences in frequency were not statistically significant.
We can more precisely compute the p-value using R:
> 1-pchisq(1.95,2)
[1] 0.3771924
Conclusion: This data does not provide evidence for a difference in disclosure rates. We conclude that there is no statistically significant association between HIV transmission risk category and disclosure (p-value=0.38). The proportion of HIV patients who disclose their status to sexual partners does not significantly differ across HIV transmission risk categories.