


One Sample t-test

Investigators wanted to determine whether children who were born very prematurely have poorer cognitive ability than children born at full term. To investigate they enrolled 100 children who had been born prematurely and measured their IQ in order to compare the sample mean to a normative IQ of 100. In essence, the normative IQ is a historical or external (μ0). In the sample of 100 children who had been born prematurely the data for IQ were as follows: X̄ = 95.8, SD = 17.5" . The investigators wish to use a one-tailed test of significance.
One-Tailed and Two-Tailed Tests of Significance
A research hypothesis that states that two groups differ without specifying direction, i.e., which is greater, is a two-tailed hypothesis. In contrast, a research hypothesis that specifies direction, e.g., that the mean in a sample group will be less than the mean in a historic comparison group is a one-tailed hypothesis. Similarly, a hypothesis that a mean in a sample group will be greater than the mean in a historic comparison group is also a one-tailed hypothesis.
Suppose we conduct a test of significance to compare two groups (call them A and B) using large samples. The test statistic could be either a t score or a Z score, depending on the test we choose, but if the sample is very large the t or Z scores will be similar. Suppose also that we have specified an "alpha" level of 0.05, i.e., an error rate of 5% for concluding that the groups differ when they really don't. In other words, we will use p≤0.05 as the criterion for statistical significance.
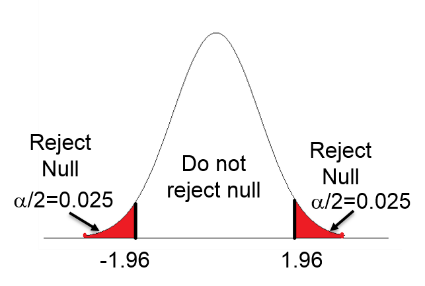
Two-tailed test: The first figure below shows that with a two-tailed test in which we acknowledge that one group's mean could be either above or below the other, the alpha error rate has to be split into the upper and lower tails, i.e., with half of our alpha (0.025) in each tail. Therefore, we need to achieve a test statistic that is either less than -1.96 or greater than +1.96.
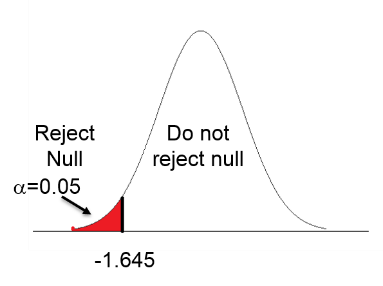
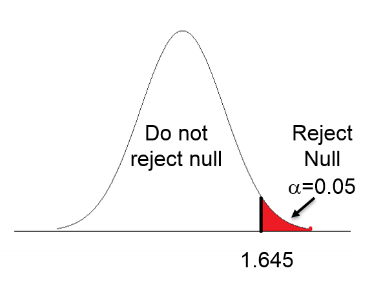
One-tailed test (lower tail): In the middle figure the hypothesis is that group A has a mean less than group B, perhaps because it is unreasonable to think the A would be greater than B. If so, all of the 5% alpha is in the lower tail, and we only need to achieve a test statistic less than 1.645 to achieve "statistical significance."
One-tailed test (upper tail): The third image shows a one-tailed test in which the hypothesis is that group A has a mean value greater than that of group B, so all of the alpha is in the upper tail, meaning that we need a test statistic greater than +1.645 to achieve statistical significance.
Clearly, the two-tailed test is more conservative because, regardless of direction, the test statistic has to be more than 1.96 units away from the null. The vast majority of tests that are reported are two-tailed tests. However, there are occasionally situations in which a one-tailed test hypothesis can be justified.
A one-tailed test could be justified in the study examining whether children who had been born very prematurely have lower IQ scores than children who had a normal, full term gestation, since there is no reason to believe that those born prematurely would have higher IQs.
A One-tailed Test of Hypothesis
First, we set up the hypotheses:
Null hypothesis: H0: μprem = 100 (i.e., that there is no difference or association)
Children born prematurely have mean IQs that are not different from those of the general population (μ0=100)
Alternative hypothesis (research hypothesis: H0:μprem < 100)
Children born prematurely have lower mean IQ than the general population (μ<100).
The t statistic= -2.4. We can look up the corresponding p-value with df=99, or we can use R to compute the probability.
> pt(-2.4,99)
[1] 0.009132283
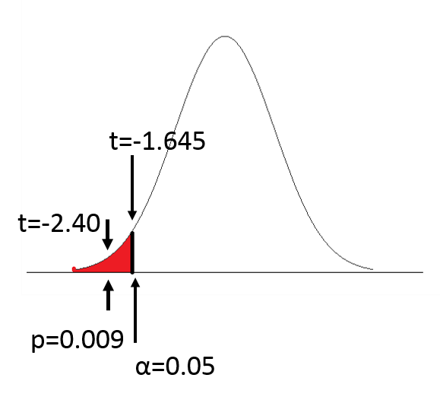
Since p=0.009, we reject the null hypothesis and accept the alternative. We conclude that children born prematurely have lower mean IQ scores than children in the general population who had a full term gestation.
A Two-tailed Test of Hypothesis
What if we had performed a two-tailed test of hypothesis on the same data?
The null hypothesis would be the same, but the alternative hypothesis would be:
Alternative hypothesis(research hypothesis: HA: μprem≠100
Children born prematurely have IQ scores that are different (either lower or higher) from children from the general population who had full term gestation.
The calculation of the t statistic would also be the same, but the p-value will be different.
> 2*pt(-2.4,99)
[1] 0.01826457
The probability (area) either lower than -2.40 or greater than +2.40 = 0.009+0.009 =0.018, i.e., we have a probability of 0.009 in both the lower and upper tail. We still conclude that children born prematurely have a significantly lower mean IQ than the general population (mean=95.8, s=17.5, p=0.018).
[When performing two-tailed tests, direction is not specified in the hypothesis, but one should report the direction in any report, publication, or presentation, e.g., "Children who had been born prematurely had lower mean IQ scores than in the general population."]
|
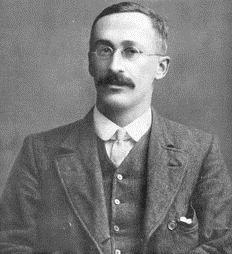
Student's t-test
The t-statistic was developed and published in 1908 by William Gosset, a chemist/statistician working for the Guinness brewery in Dublin. Guinness employees were not allowed to publish under their own name, so Gosset published under the pseudonym "Student". |
One Sample t-test Using R
In the example for IQ tests above we were given the mean IQ and standard deviation for the children who had been born prematurely. However, suppose we were given an Excel spreadsheet with the raw data listed in a column for "iq"?
In Excel we could save this data as a .CSV file using the "Save as" function. We could then import the data in the .CSV file into R and analyze the data as follows:
[Note that R defaults to performing the more conservative two-tailed test unless a one-tailed test is specified as we will describe below.]
> t.test(iq,mu=100)
One Sample t-test
data: iq t = -2.3801, df=99, p-value = 0.01922
alternative hypothesis: true mean is not equal to 100
95 percent confidence interval:
92.35365 99.30635
Sample estimates
mean of x
95.83
In order to perform a one-tailed test, you need to specify the alternative hypothesis. For example:
> t.test(iq,mu=100, alternative="less")
or
> t.test(iq,mu=100, alternative="greater")
