Ecological Studies (Correlational Studies)
Ecologic studies assesses the overall frequency of disease in a series of populations and looks for a correlation with the average exposure in the populations. These studies are unique in that the analysis is not based on data on individuals. Instead, the data points are the average levels of exposure and the overall frequency of disease in a series of populations. Therefore, the unit of observation is not a person; rather, it is an entire population or group.
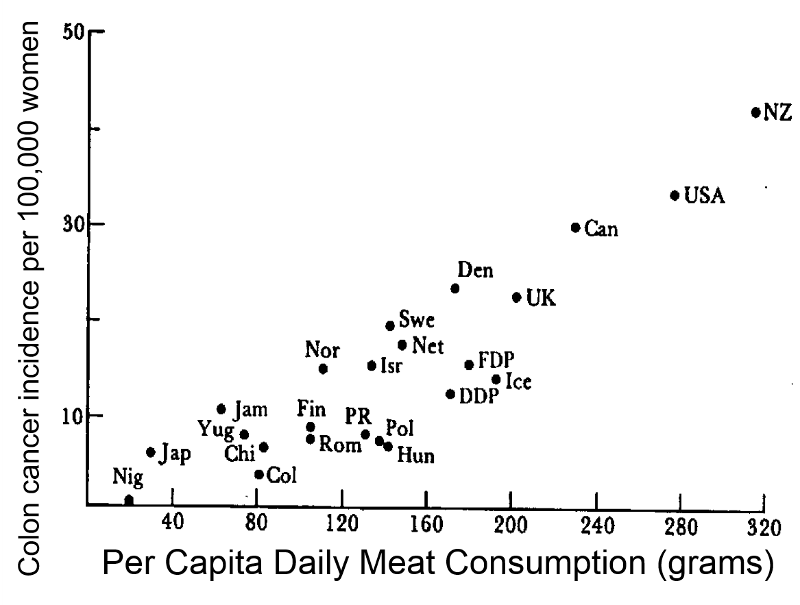
In the study below investigators used commerce data to compute the overall consumption of meat by various nations. They then calculated the average (per capita) meat consumption per person by dividing total national meat consumption by the number of people in a given country. There is a clear linear trend; countries with the lowest meat consumption have the lowest rates of colon cancer, and the colon cancer rate among these countries progressively increases as meat consumption increases.

Note that in reality, people's meat consumption probably varied widely within each nation, and the exposure that was calculated was an average that assumes that everyone ate the average amount of meat. This average exposure was then correlated with the overall disease frequency in each country. The example here suggests that the frequency of colon cancer increases as meat consumption increases. The characteristic of ecological studies that is most striking is that there is no information about individual people. If the data were summarized in a spread sheet, you would not see data on individual people; you would see records with data on average exposure in multiple groups .
|
Advantages of Ecologic Studies
|
|
Limitations of Ecologic Studies
|
Example:
An ecological study correlated per capita alcohol consumption to death rates from coronary heart disease (CHD) in different countries, and it appeared that there was a fairly striking negative correlation as shown in the graph below.

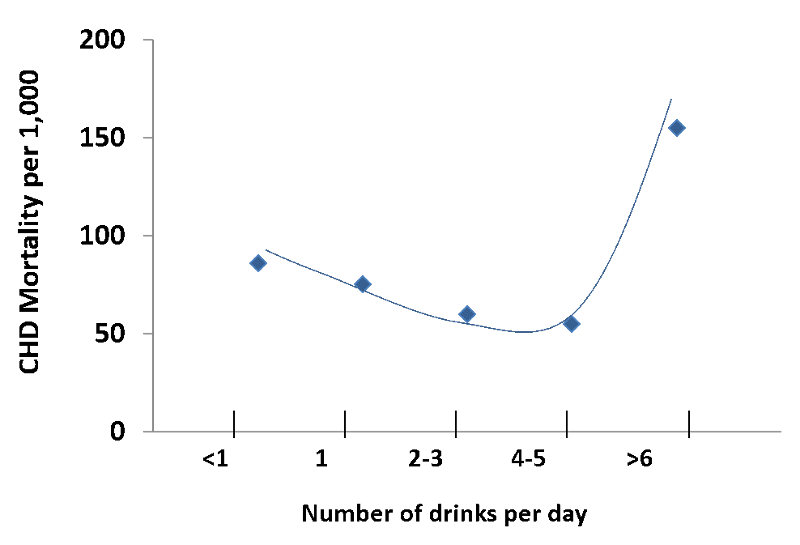
However, a cohort study with data on alcohol consumption in individual subjects showed that there was a J-shaped relationship. People who drank modestly had a lower mortality rates than those who did not drink at all, but among higher levels of individual consumption there was a striking linear increase in mortality, as shown in the graph below.

Source: Adapted from AR Dyer et al. Alcohol consumption and 17-year mortality in the Chicago Western Electric Company Study. Prev. Med. 1980; 9(1):78-90.
The real question was whether individuals who drank heavily had higher or lower mortality rates than those who drank modestly or not all, but the ecologic study led to an incorrect conclusion because it was based on aggregate data. In reality, most people drink modestly, but mortality rates are much greater in the small number of people who drink very heavily. The misleading conclusion from the ecologic study is an example of the ecologic fallacy.
Test Yourself

To see an extraordinary example of an ecologic study, play the video below created by Hans Rosling. This is a magnificent example that examines the correlation between income and life expectancy in the countries of the world over time. It is also a terrific example of a creative, engaging, and powerful way to display a vast quantity of data.


