


Cross-Sectional Surveys
Cross-sectional surveys assess the prevalence of disease and the prevalence of risk factors at the same point in time and provide a "snapshot" of diseases and risk factors simultaneously in a defined population. For example, US government agencies periodically send out large surveys to random samples of the US population, asking about health status and risk factors and behaviors at that point in time. The Health Interview Survey (HIS) and the National Health and Nutrition Examination Survey (NHANES) are good examples.
The health questionnaires you are asked to fill out when you go to a new physician or being processed for a new job, or prior to entry into military service are similar to cross-sectional surveys in that they ask about the health problems that you have (heart disease? diabetes? asthma?) and your current behaviors and risk factors (e.g., How old are you? Do you smoke? What is your occupation?).
Cross-sectional surveys ask people their current status with respect to both exposures and diseases. They are often referred to as "prevalence studies," because they assess the prevalence of exposures and health outcomes at a point in time. They have two main disadvantages.
Key points to remember about cross-sectional surveys:
- Data on exposure status and health outcome status are collected from each respondent at the same point in time.
- They provide a "snapshot" of prevalence at a point in time.
- They assess the needs of the population, i.e., the burden of diseases, and the frequency of health related behaviors (e.g., smoking, exercise, seat belt use, etc.) at a point in time.
- Cross-sectional surveys assesses prevalence at a point in time in random samples of a population. While they assess prevalence at a point in time, they can be repeated at different points in time to assess trends, as illustrated in the image below. Which shows that the prevalence of obesity in the US population increased from 12% to 35% from 1960 to 2001.
- It is important to note that cross-sectional surveys are not repeated in the same individuals, i.e., there is no follow up. They are cross-sectional pictures of a population, not longitudinal follow-up studies in which individuals are followed over time.

|
Limitations of Cross-sectional Surveys:
These limitations are discussed below. |
Temporal Relationship Between Exposure and Outcome
Consider the following example in which a survey was conducted among white male farm workers. The survey asked many questions, but among them were the questions: "Have you been told you have coronary heart disease (CHD)?" And "How would you classify your level of physical activity?" The table below summarizes the findings.
Table - Current Activity and Coronary Heart Disease Among Male Farm Workers
|
# of Respondents |
# Respondents With CHD |
Prevalence of CHD per 1,000 |
|
|
Currently Not Active |
89 |
14 |
157 |
|
Currently Active |
90 |
3 |
38 |
Note that the investigators did not follow these subjects over a period of time, so they did not assess the "incidence" of heart disease. Instead, they asked the subjects questions designed to determine the prevalence of heart disease, i.e., the proportion of the study population that had heart disease at this particular point in time. When they divided the sample into physically active and inactive farmers and computed the prevalence of heart disease in each of these, they found that CHD was much more prevalent among the inactive farmers. However, this was a cross-sectional study that related the prevalence of disease to the prevalence of activity at a point in time. They did not follow subjects over time to track the development of heart disease (i.e., the incidence). Consequently, the temporal relationship between the risk factor of interest (physical inactivity) and the outcome (CHD) is unclear.
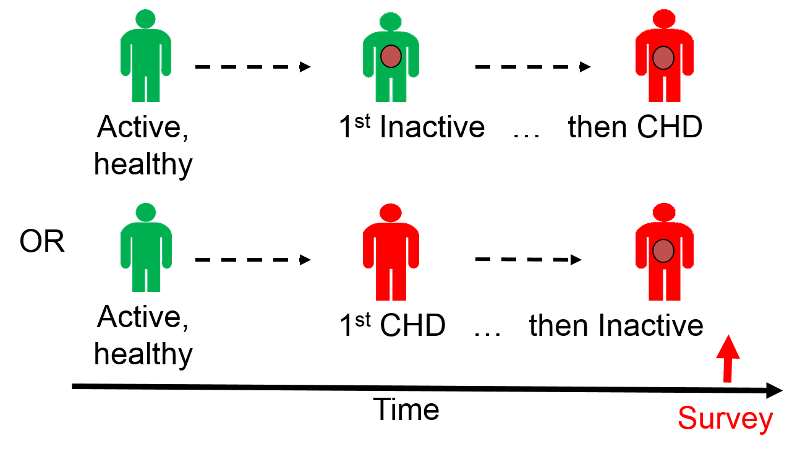
Had the farmers been physically active prior to developing CHD? Or, did they begin to limit their physical activity after they developed CHD? It is unclear. Consequently physical inactivity could have been either a cause of heart disease, or it could have been a consequence of CHD.
Large cross-sectional surveys are important for monitoring health status and health care needs of the population over time, and they are sometimes useful for suggesting possible associations between risk factors and diseases. However, the temporal relationship between the risk factor and disease is frequently unclear. Under these circumstances, they can generate hypotheses, but these associations need to be tested by appropriate analytical studies.
However, note that under some circumstances, the temporal relationship is clear on a cross-sectional survey. For example, if one conducted a survey of salaries of male and female professors to see if sex was associated with salary inequities, we could regard this as an analytical study, because it is clear that sex was established long before salary level. In this situation the temporal relationship between the "exposure" of interest (sex) and outcome (salary paid) is clear; we know that gender was established before the salary was negotiated. So, in a sense cross-sectional studies (and ecological studies can be thought of as an intermediate category between descriptive and analytic studies.
Identification of Cases of Long Duration
A second limitation of cross-sectional studies is that they are more likely to identify cases of long duration, and this can bias the results.
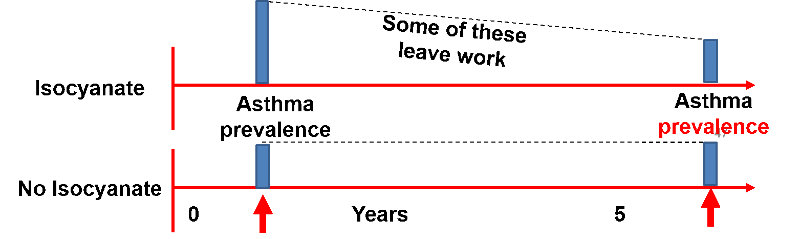
Example: Isocyanates are chemicals that can cause occupational asthma that gets progressively worse over time. In a cross-sectional study of isocyanates and occupational asthma, the prevalence of asthma was lower in factory workers with >5 years employment vs. those with <5 years employment, because those with isocyanate exposure and asthma were more likely to leave.
Below is a hypothetical time line showing the apparent prevalence of occupational respiratory problems in workers exposed to isocyanates and unexposed workers. After one year of working the prevalence of respiratory problems is two-fold greater in the isocyanate workers, but by seven years the prevalence is similar, because the isocyanate workers who developed respiratory problems left and found other work.
Test Yourself