


Introduction
The Framingham Heart Study (FHS) began in 1948 when investigators enrolled 5,209 men and women aged 30-62 from Framingham, Massachusetts. Subjects provided baseline information on many variables, and they returned to the study office every two years for a detailed medical history, physical examination, and lab tests. They also monitored the cohort carefully and recorded adverse health outcomes, focusing primarily on cardiovascular diseases. In 1971 they enrolled a second cohort consisting of the offspring cohort of the initial cohort, and in 2002 they enrolled a third cohort consisting of the grandchildren of the original cohort. The data that was collected, and the many subsequent analyses that have been conducted led to the identification of the major risk factors for cardiovascular disease: high blood pressure, high blood cholesterol, smoking, obesity, diabetes, physical inactivity, and many other risk factors.
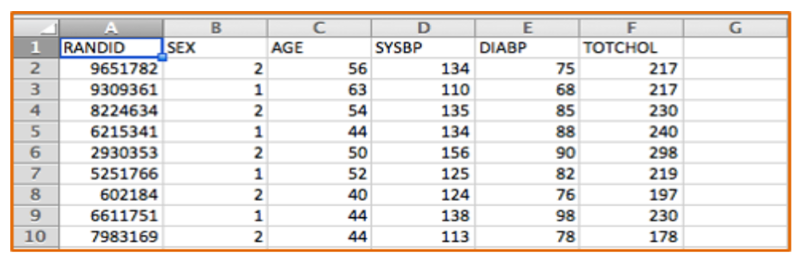
One can think of the data collected in the Framingham study and others as a series of tables with many variables (demographic information, exposures and outcomes) in the columns and each subject listed on a separate row. The figure below shows a portion of an Excel spreadsheet that was used to download the first 10 subjects in a very small subset of the FHS data. There is a random identification number in the first column, and columns indicating each subject's sex, age in years, systolic blood pressure, and total cholesterol. There are many more variables, but this small subset gives you an idea of the structure of a data set.
Excel spreadsheets can be used to collect and store tables of data of this type, and Excel can also be used for a variety of simple statistical tests. For example, Excel can perform chi-squared tests, t-tests, correlations, and simple linear regression. However, it has a number of limitations. Public health researchers and practitioners frequently perform more complex analyses, such as multiple linear regression and multiple logistic regression, which cannot be performed in Excel, so it is useful to become familiar with more sophisticated packages like R.
[NOTE: An online learning module is available for students who would like to learn to use Excel at Using Spreadsheets - Excel & Numbers]
One key advantage to collecting or importing data into Excel is that the data can then be saved as a .CSV file, that is as a "comma-separated values" file that can easily be imported into the R statistical package. We will be using a number of data files that have been saved as .CSV files for this course.
The R statistical package is a powerful open-source program that is free. It will allow you to perform all of the necessary statistical procedures for this course, and it will likely be useful to many of you for professional projects. In addition, R will enable you to produce excellent graphics (even better than those produced with SAS).
This exercise will introduce you to using R, even if you have no prior experience. The exercise will walk you through how to install R, how to import data sets, and how to analyze your data.
Learning Objectives
After completing this section, you will be able to:- Install R and R Studio on your personal computer
- Be familiar with some basic R programming functions:
- Navigate the R console
- Enter R commands
- Bring a data set into R
- Perform basic descriptive statistics
- Create some simple graphs