

Graphs
# Make a histogram of the age distribution
hist(age)

# Make a histogram and a boxplot of bmi
hist(bmi)
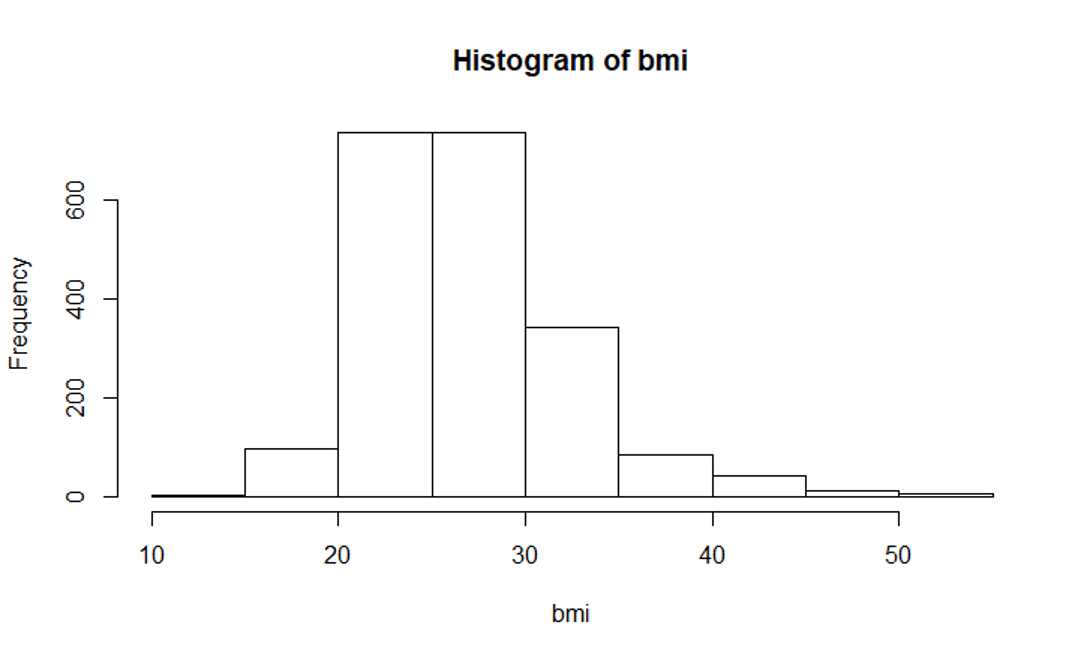
Next
boxplot(bmi)
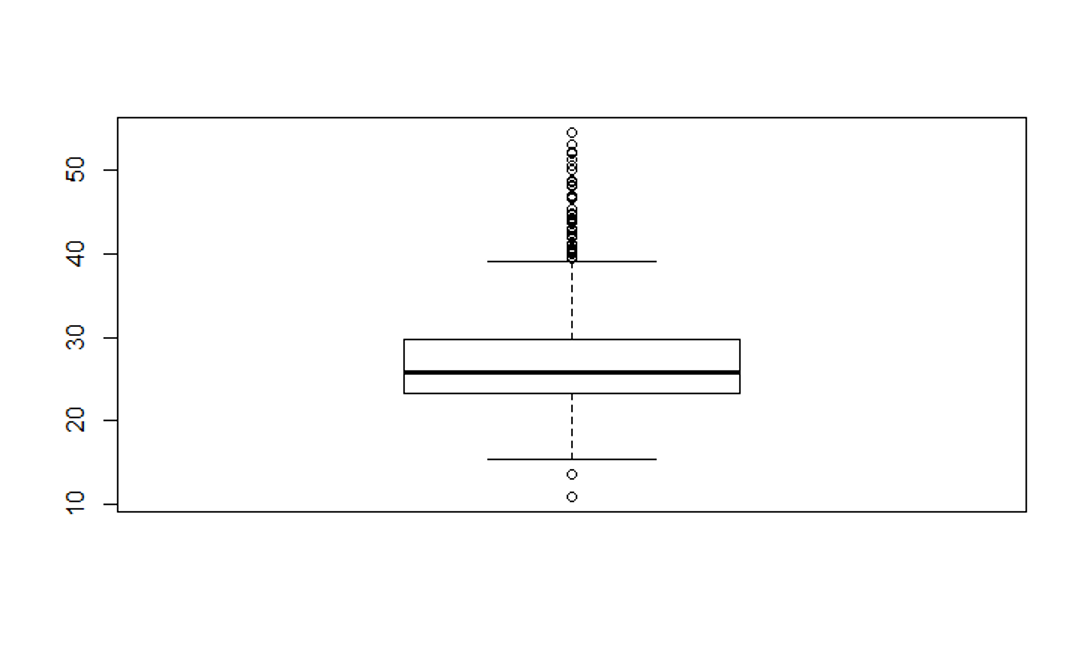
Next
boxplot(bmi, horizontal = TRUE)
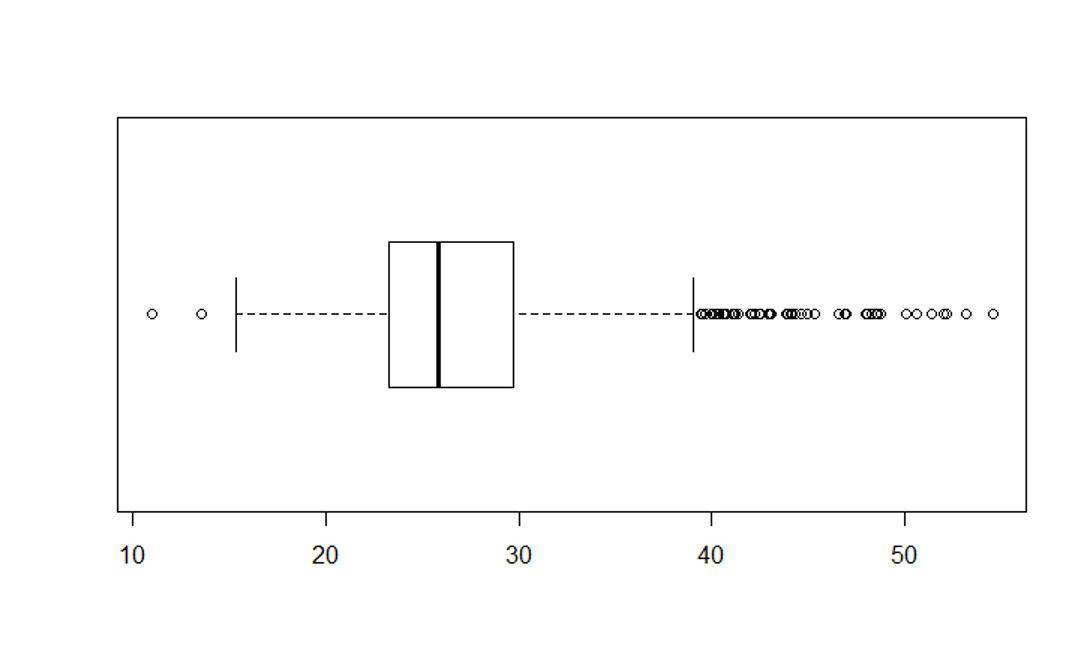
# Next, modify the boxplot to a horizontal orientation
boxplot(age, horizontal = TRUE)
# Modify the BMI histogram with the code below
hist(bmi, main="BMI Distribution in Weymouth Adults",
xlab = "BMI", border="blue", col="green", xlim=c(10,50),
las=1, breaks=8)

Once you have everything working, save your script for future reference. You will be using these coding functions throughout the course.
Finally, go back to page 8 of the online case on Weymouth and read pages 1-4 of the Executive Summary in the JSI report (http://sphweb.bumc.bu.edu/otlt/MPH-Modules/PH/SWNAS/Weymouth%20Health%20Survey%20Report.pdf ) based on the survey data.
Also scan the news article from the Boston Globe embedded on page 8 of the Weymouth case module. You can also access it from