
Simple Math Functions and Commands in R
For the exercise below:
- Non-executed comments are indicated by #
- Commands are indicated by > [command}
- R output is indicated in black
Try entering the following commands in the R Console at the lower left window. You do not have to enter the comments in green. Just enter the commands in blue and hit ?Enter?. You should see the result written in black after the [1].
# Addition
> 7+3
[1] 10
# Subtraction
> 7-3
[1] 4
# Multiplication
> 8*7
[1] 56
#Division
> 100/50
[1] 2
# Square root
> sqrt(81)
[1] 9
# Exponents
> 9^2
[1] 81
Practice Exercise
First, download the framstudy.csv data set onto your local computer. Then import the data set into R. There are two ways to do this.
The Easy Way
The easiest way is to click on the "Import Dataset" button at the upper right in the RStudio console and then browse your computer and follow the instructions. If the dialog asks if the data set has a header, say "yes", since this data set and others for this course have headers (i.e., titles) for their columns.
- NOTE #1: In the newest version of R clicking on the "Import Dataset" tab produces a short drop down menu from which you should choose the second (readr) selection for CSV file. You will then be prompted to install an additional package into R.
- NOTE #2: If you are using Chrome as your browser, you may have problems importing data sets into R. If so, try using Safari or Firefox.
Once the file has been imported, we usually give it a short nickname to cut down on typing:
> fram <- framstudy
"fram" is a short name or a nickname that I made up for the data set to reduce typing during programming. The "less than" character followed by a dash (<- ) looks a bit like an arrow and functions as an assigner to tell R that we are assigning a name to a data set we are importing.
The Traditional Way (harder)
You can also use the traditional R command below as an alternative.
> fram <- read.csv(file.choose()) and then click "Run" or hit the "Enter" key.
> read.csv(file.choose()) is a function, a set of hard-coded instructions that tells R how to complete a task, e.g., how to open and read a chosen csv file.
Once the data set has been imported, you should "attach" the data so that R defaults to performing actions on this particular data set.
> attach(fram)
If you finish with an attached data set and want to work with another data set, you should detach the first one [ > detach(fram)] and then attach the new one.
View the Data Set in R
> View(fram) [Then hit the enter key or click on the ?Run? tab to execute the command]
View() is a function that tells R to open a new window so that we can look at the data set. To view the data you can also just click on the data set name in the upper right window.
Once you have imported the data set, it will be listed in the "Environment" tab in the window at the upper right. If you have a large data set, it is better to just click on the small blue arrow next to the data set name in the Environment section to view it.
Writing Code in R - Important Notes
- R is case-sensitive, so be consistent in the way you name variables. Also note that most commands in R are lower case, e.g., attach(fram), but a few start with an upper case letter, e.g., View(fram).
- # at the beginning of a line of code indicates that it is a comment, so the text that follows it will not be executed as code. Adding comments is useful for letting others understand what you are doing, and it also reminds you if you go back to modify the code that you saved in a script.
- <- and = are equivalent operators that can be used to assign names or values variables and "objects", e.g., an object might be a table of output.
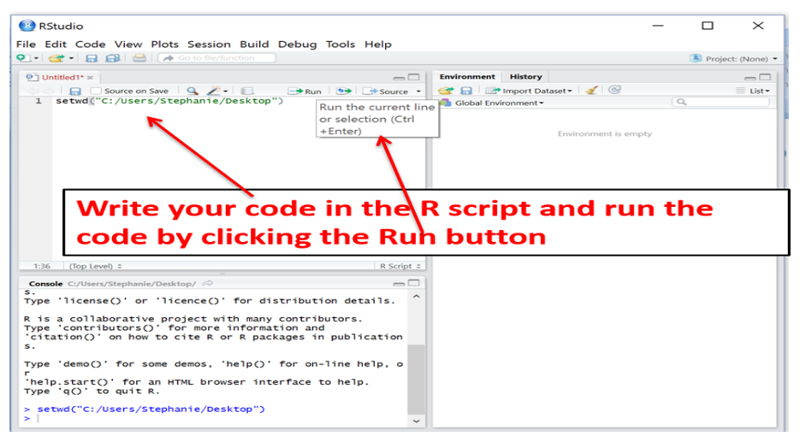
You can execute code one step at a time in the console (lower left window), and this is useful for quick one step math calculations, but it is usually more convenient to list all of your coding statements in a script in the window at the upper left and then saving the script for future use. When you enter code into the script window at the upper left, do not begin the line with a > character. You can also execute the code from the script editing window by clicking on the "Run" tab at the top of the editing window. To save a script, click on the "File" tab at the upper left and select either Save as or Save.
To start a new script, click on the File tab, then on New File, then on R Script.
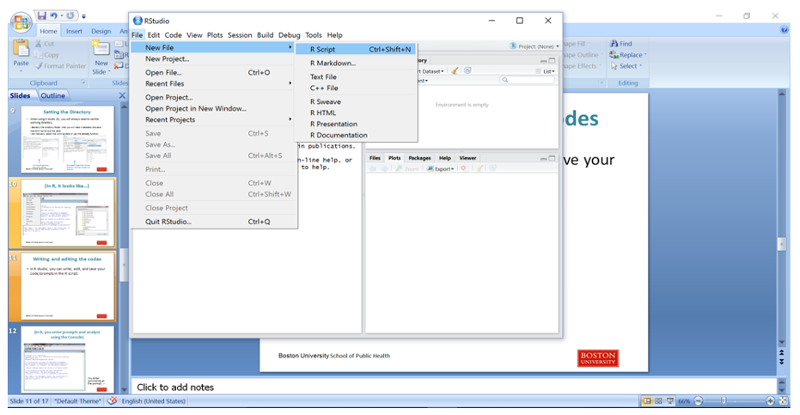
Then type in your coding statements.
Here is a short sample script:
# (A comment) Import the framstudy.csv file and call it "fram"
########################
fram<-framstudy
# Next attach the file to tell R it is the "go to" file (the default)
attach(fram)
View(fram)
# Determine the mean, median, and distribution of continuous variables
quantile(AGE)
summary(AGE)
# Determine the number and proportion of males and females
table(SEX)
prop.table(table(SEX))
# Make a mistake in nameing a variable (case)
summary(Age)
Enter the script above into the R editor and save it as follows:
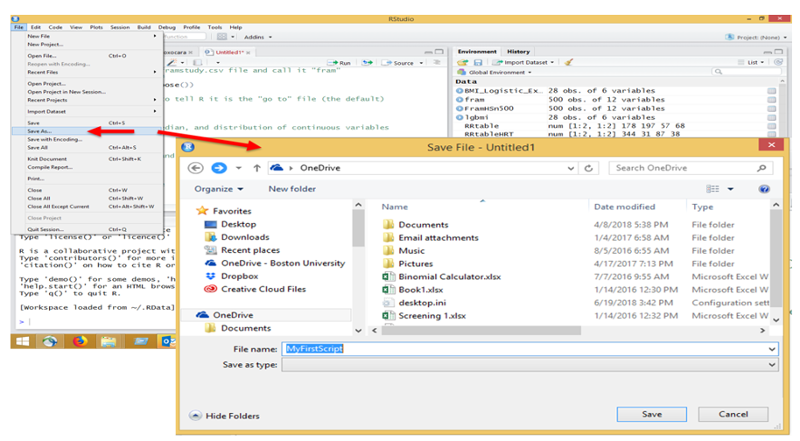
Then execute the script by hitting the "Run" tab repeatedly in the editor. When you get to the "View(fram)" step, the editor will show the data file, but you can return to the script by clicking on the tab for the script at the top of the window.
The output from the executed script will appear in the Console window at the lower left, and it should look like this:
> fram<- framstudy
> attach(fram)
> View(fram)
> quantile(AGE)
0% 25% 50% 75% 100%
39 45 52 59 65
> summary(AGE)
Min. 1st Qu. Median Mean 3rd Qu. Max.
39.00 45.00 52.00 52.41 59.00 65.00
> table(SEX)
SEX
1 2
19 30
> prop.table(table(SEX))
SEX
1 2
0.3877551 0.6122449
> summary(Age)
Error in summary(Age) : object 'Age' not found
Note that there was an error message because we gave the command "summary(Age)", but the variable for age is all upper case (AGE), so R did not find it.