Obesity
In 1949, Ancel Keys warned of a possible epidemic of obesity that would be caused by a combination of economic and social conditions. Keys said, "While our calorie intake goes up our output goes down. The wonderful advances of technology not merely free us from backbreaking toil; they make it almost impossible to get a decent amount of calorie-using exercise."
Excess body fat is indicative of a metabolic condition that is associated with an increased risk of adverse health events including cardiovascular disease, some cancers, type 2 diabetes, hypertension (high blood pressure), dyslipidemia (for example, high total cholesterol or high levels of triglycerides), stroke, gallstone disease, sleep apnea, and gastroesophageal reflux disease (GERD).

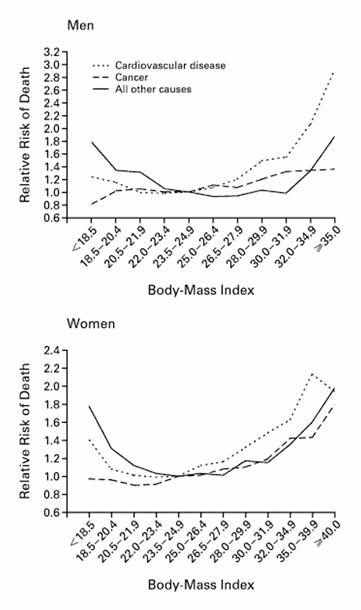
Source: Calle EE, et al.: N Engl J Med 1999; 341:1097-1105
Obesity is most commonly quantified by calculating the body mass index (BMI) which expresses total body weight in kilograms indexed to height (expressed as meters squared). The graphs to the left shows the relationship between BMI and risk of death from cardiovascular disease, cancer, and other causes for a large cohort of men and women. The table below shows the most commonly used classification of obesity based on the BMI in adults.
| BMI |
Classification |
|---|---|
|
Below 18.5 |
Underweight |
|
18.5 – 24.9 |
Normal |
|
25.0 – 29.9 |
Overweight |
|
30.0 and above |
Obese |
You can calculate your BMI using the "widget" below from the CDC.
There has been a dramatic increase in the prevalence of obesity in the United States; it is currently estimated that about a third of adults in the US are obese. Click here http://www.cdc.gov/obesity/data/trends.html to see the prevalence of obesity from 1985 to 2010 through an animated series of maps of the United States. However, the BMI can be misleading, since it does not take into account muscular development or distribution of body fat, and classification of childhood obesity needs to take into account age and gender. For example, "central adiposity," i.e., fat deposition primarily in the torso (the apple-shaped person) is more indicative of an increased risk of cardiovascular disease. This is defined based on measurement of waist circumference, i.e.,
-
Men - 40 inches or more
-
Women - 35 inches or more
and central adiposity is one of the criteria for the metabolic syndrome (see below).
Assessing Obesity in Children
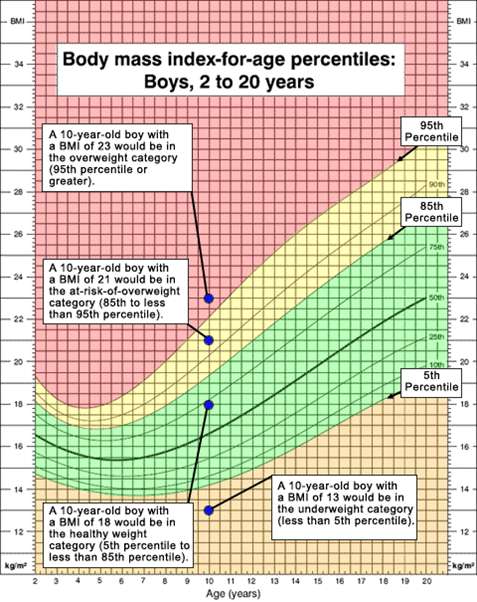
For individuals between the ages of 2-20 years of age, classification of obesity uses a nomogram that establishes the individual's percentile of BMI based on age and gender. The figure below shows the nomogram for males and provides several examples for hypothetical boys plotted as shown by the blue dots.

Source: Centers for Disease Control and Prvention
The CDC classifies individuals above the 95th percentile for age and gender as as overweight (The Institute of Medicine would classify these individuals as obese.) Boys who fall between the 85th-95th percentile are classified as "at risk of overweight" by CDC (... and IOM would classify them as overweight). Boys below the 5th percentile are classified as underweight for age.
The Centers for Disease Control (CDC) also have an online "widget" which will calculate results for a child after entering their age, height, and weight.
See http://http://nccd.cdc.gov/dnpabmi/Calculator.aspx
Metabolic Effects of Obesity
With obesity there is increased delivery of fatty acids to muscle cells, and this leads to the dysfunctional interaction between insulin and its receptors a defect in insulin signaling through insulin receptor substrate. Resistance to insulin leads to generalized insulin resistance and increased release of fatty acids from fat cells. The liver synthesizes and secretes increased amounts of very low-density lipoprotein (VLDL). Exercise reverses these abnormalities by diverting fatty acids in muscle toward mitochondrial oxidation.
Hemodynamic Effects of Obesity
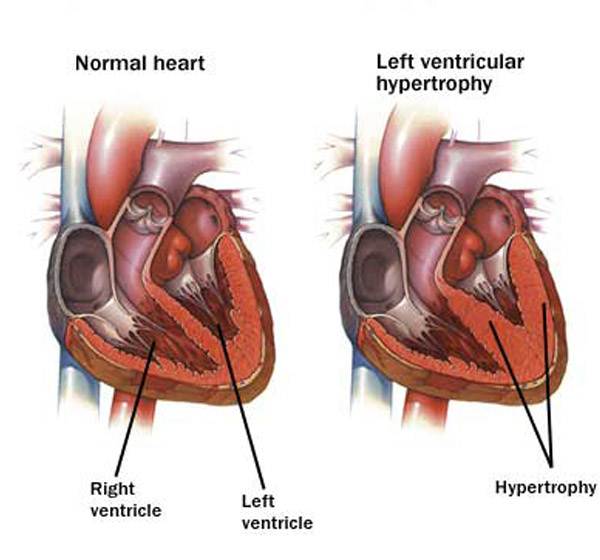
In obese individuals, the cardiac workload is greater than in lean people at any level of activity. This is caused by an increased metabolic demand which produces an increment in total blood volume and cardiac output. The increase in cardiac output is attributed to increased stroke volume . Another effect of obesity is seen in an increase in left ventricular filling pressure and volume, which can lead to the production of chamber dilation, a condition that causes increased wall stress and predisposes to an increase in myocardial mass and left ventricular hypertrophy (LVH
 ). Obese individuals also have a further increase in cardiac filling pressures during exercise. Weight reduction causes a decrease in central blood volume, as well as relief of some other conditions that are associated with obesity.

Source: http://epharmapedia.com/diseases/profile/296/Left-ventricular-hypertrophy.html?lang=en
The Metabolic Syndrome
Many individuals have a cluster of risk factors called the metabolic syndrome. These factors include abdominal obesity, atherogenic dyslipidemia (elevated triglyceride, small LDL particles, low HDL cholesterol), raised blood pressure, insulin resistance (with or without glucose intolerance), and prothrombotic and proinflammatory states. Individuals with this constellation of risk factors have an increased risk for coronary artery disease, stroke, and type 2 diabetes. According to the American Heart Association and National Heart, Lung and Blood Institute, metabolic syndrome is present if you have 3 or more of these traits:
- Blood pressure equal to or higher than 130/85 mmHg
- Fasting blood sugar (glucose) equal to or higher than 100 mg/dL
- Large waist circumference Men: 40 inches or more; Women: 35 inches or more
- Low HDL cholesterol - Men: under 40 mg/dL; Women: under 50 mg/dL
- Triglycerides equal to or higher than 150 mg/dL
An individual with metabolic syndrome has a 1.4 fold increased risk of all-cause mortality and a 2.3-2.8 fold increased risk of cardiovascular death.
Recommendations are similar to those for preventing and treating cardiovascular disease in general:
- Lose weight- the goal is to lose between 7% and 10% of your current weight by consuming 500 to 1,000 fewer calories per day
- Exercise- get 30 minutes of moderate intensity exercise 5-7 days per week
- Lower cholesterol- by exercise, change of diet and medication (if needed)
- Lower blood pressure- also by exercise, change of diet and medication (if needed)
- Some people may need to take daily low-dose aspirin
- People who smoke should quit
Community Strategies to Reduce Obesity
The Centers for Disease Control and Prevention (CDC) has published a list of community strategies and guidelinesthat can be undertaken to reduce obesity. They can be accessed at this link:
http://www.cdc.gov/obesity/resources/strategies-guidelines.html or in the frame below.


