


Crude Rates
Crude rates are quite simple and straightforward. They are calculated by dividing the total number of cases in a given time period by the total number of persons in the population. In this case Population B has a higher crude rate of disease. If we think about these two populations as the 'exposures' of interest, does this imply that it is riskier to live in Population B compared to Population A?
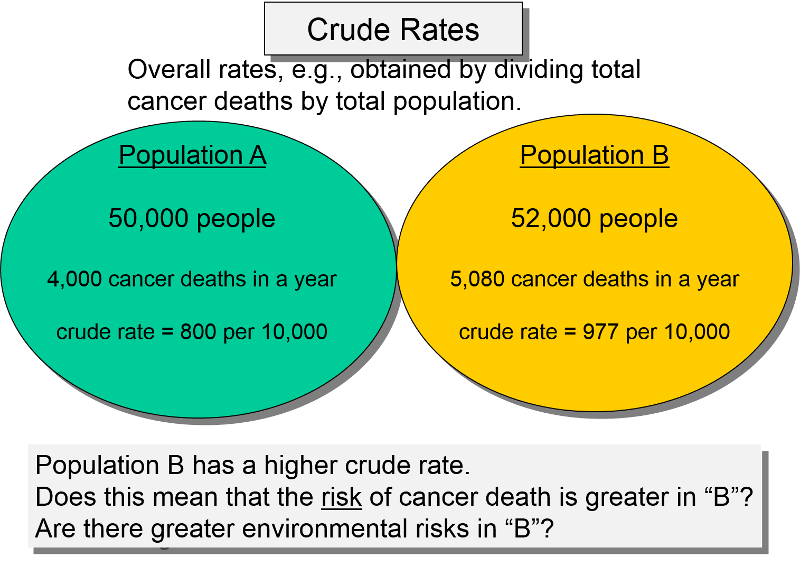
The problem with this comparison is that the crude rate is an overall average rate of disease, but it doesn't take into account possible confounding factors.
A confounding factor is basically another risk factor for the outcome of interest that is also unequally distributed among the populations being compared. In this case, age is clearly an independent risk factor for cancer mortality, but what we really would like to know is whether there are differences in cancer mortality between the two populations that are not due to age differences, i.e., differences in mortality that are independent of age differences. If the two populations have unequal age distribution, it will distort the comparison of interest.
For example, Population B might have a greater percentage of older people, and we know that the risk of cancer mortality increases with age regardless of one's environment. If so, then the risk of death due to cancer in Population B might only appear to be greater simply because it has a greater percentage of old people who have an inherently greater risk of dying. In other words, the crude mortality rate for population B might be higher just because it is weighted more heavily with old people. In this setting we might be interested in comparing the mortality rates without the unwanted confounding effect of age.
This problem is clearer if we take a more detailed look by examining the age-specific mortality rates within each of these populations, as shown below.
Age-Specific Rates
In this hypothetical example, the table below shows that the age-specific mortality rates are absolutely identical in the two populations. In other words, in any given age group, the two populations have the same risk. However, note that the risk of mortality increases with age. Note also that Population B has a greater percentage of older people. In other words, population B is more heavily weighted with older people, and age is also associated with risk of mortality, so the comparison of crude rates is unfair, because of the unequal age distributions.
Table - Population A
|
Age Group |
Number of Deaths |
Number of People |
Death Rate per 10,000 |
|---|---|---|---|
|
30-39 |
400 |
10,000 |
400 |
|
40-49 |
600 |
10,000 |
600 |
|
50-59 |
800 |
10,000 |
800 |
|
60-69 |
1,000 |
10,000 |
1,000 |
|
70-79 |
1,200 |
10,000 |
1,200 |
|
Totals |
4,000 |
50,000 |
800 |
Table - Population B
|
Age Group |
Number of Deaths |
Number of People |
Death Rate per 10,000 |
|---|---|---|---|
|
30-39 |
80 |
2,000 |
400 |
|
40-49 |
300 |
5,000 |
600 |
|
50-59 |
800 |
10,000 |
800 |
|
60-69 |
1,500 |
15,000 |
1,000 |
|
70-79 |
2,400 |
20,000 |
1,200 |
|
Totals |
5,080 |
52,000 |
977 |
Since the age-specific rates are identical, the risk of cancer mortality is exactly the same in these two populations. What makes the crude rates different is that older people have a higher risk of cancer mortality, and population B has a greater proportion of older people. In other words, the age-specific rates are the same, but the higher proportion of older people in population B means that the overall crude rate is more heavily weighted by the age-specific rate among older people.