


Life Tables and Survival Analysis
(Optional)
The equation CI = IR x T provides a reasonable estimate of risk when the incidence rate is relatively constant, but this isn't always the case. When the incidence rate changes over time there are other options for estimating risk.
- One could calculate risk serially over shorter time intervals during which risk is reasonably constant. However, the intervals have to be long enough to enable meaningful incidence rates for each interval.
- Another approach that is useful when risk is changing over time is to use survival analysis. Despite the name, it can be used for any outcome regardless of whether it is fatal or not. The table below shows a hypothetical life-table cited by Rothman
 .
.
Table - Life-table for Death from Motor-vehicle Injury from Bitth through Age 85
|
Age (years) |
Mortality Rate per 100,000 person-years |
At Risk |
Deaths in Interval |
Risk |
Survival Probability |
Cumulative Survival Probability |
|---|---|---|---|---|---|---|
|
0-14 |
4.7 |
100,000 |
70.5 |
0.000705 |
0.999295 |
0.999295 |
|
15-24 |
35.9 |
99,930 |
358.1 |
0.003584 |
0.996416 |
0.995714 |
|
25-44 |
20.1 |
99,571 |
399.5 |
0.004012 |
0.995988 |
0.991719 |
|
45-64 |
18.4 |
99,172 |
364.3 |
0.003673 |
0.996327 |
0.988077 |
|
65-84 |
21.7 |
98,808 |
427.9 |
0.004331 |
0.995669 |
0.983798 |
Adapted from Iskrant and Joliet
In this hypothetical example, the initial population at risk was arbitrarily set at 100,000, and the mortality rates in each group (column 2, mortality rates=deaths per 100,000 person-yrs.) were used to calculate the number of deaths among those remaining at risk for each interval using the formula CI = IR x T. Thus, the first age group spanned 15 years and the mortality rate was 4.7/100,000 person-years, so the number of deaths was 4.7 x 15 = 70.5.
The illustration below shows the results of analysis of a trial looking at the ability of zidovudine (an anti-retroviral drug used in the treatment and prevention of HIV) to reduce maternal to child transmission. Pegnant women with mildly symptomatic HIV disease and no prior treatment with antiretroviral drugs during the pregnancy, were randomly assigned to one of two regimens: 1) a regimen consisting of zidovudine given ante partum and intra partum to the mother and to the newborn for six weeks or 2) placebo.
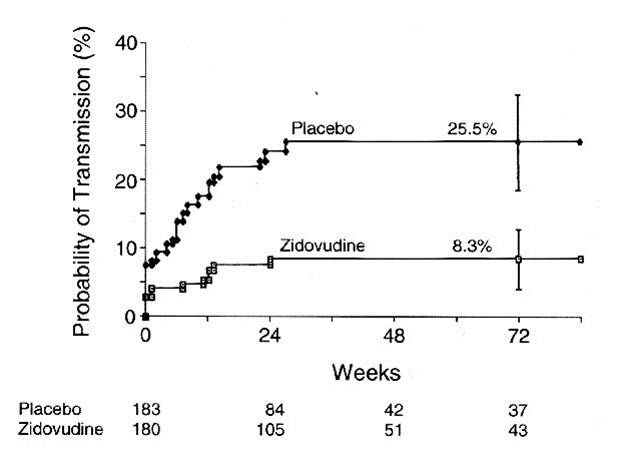
The graph shows that about 8 % of the infants in the placebo group tested HIV+ at birth, and the probability of HIV transmission in this group rose to 25.5% by 72 weeks of age. Infants in the zidovudine group only had about a 3% probablility of being born HIV+, and their risk of transmission only todr yo 8.3% by 72 weeks of age. (The data are from Connor EM, et al.: Reduction in maternal-infant transmission of human immunodeficiency virus type 1 with zidovudine treatment. N. Engl. J. Med. 1994;331:1173-1180, as quoted in the textbook by Aschengrau and Seage in Table 7-5, page 191 in the 2nd edition.) This was part of protocol 076 that originally demonstrated the efficacy of zidovudine in women in the United States and France. The illustration below shows Kaplan-Meier plots of the probability of HIV transmission for the two groups. The estimated percentages of infants infected at 72 weeks are shown with 95 percent confidence intervals. The numbers of infants at risk at 24, 48, and 72 weeks are shown below the figure.